
By Naupaka Zimmerman and John Zobitz
We (Naupaka and John) are faculty at primarily undergraduate institutions (PUIs) where our lives are a blend of teaching and scholarship. We’re always looking for projects that impact our teaching, mentoring, and scholarship duties simultaneously—those sweet spots where one effort advances multiple aims. Due to higher teaching loads and institutional missions that focus on undergraduate research, it can be challenging for PUI faculty to collect comprehensive datasets to answer large-scale questions in ecology and environmental science on their own. That’s where resources such as the National Ecological Observatory Network (NEON) come in. Datasets from NEON enable faculty at all types of institutions to tackle large-scale ecological questions and represent ready-to-go empirical data products that also work great for classroom use. Since 2014, NEON scientists and technicians have worked hard to collect, quality check, and make available rich ecological datasets from across the country, giving us as researchers a massive catalog of openly available environmental data to work (and play!) with.
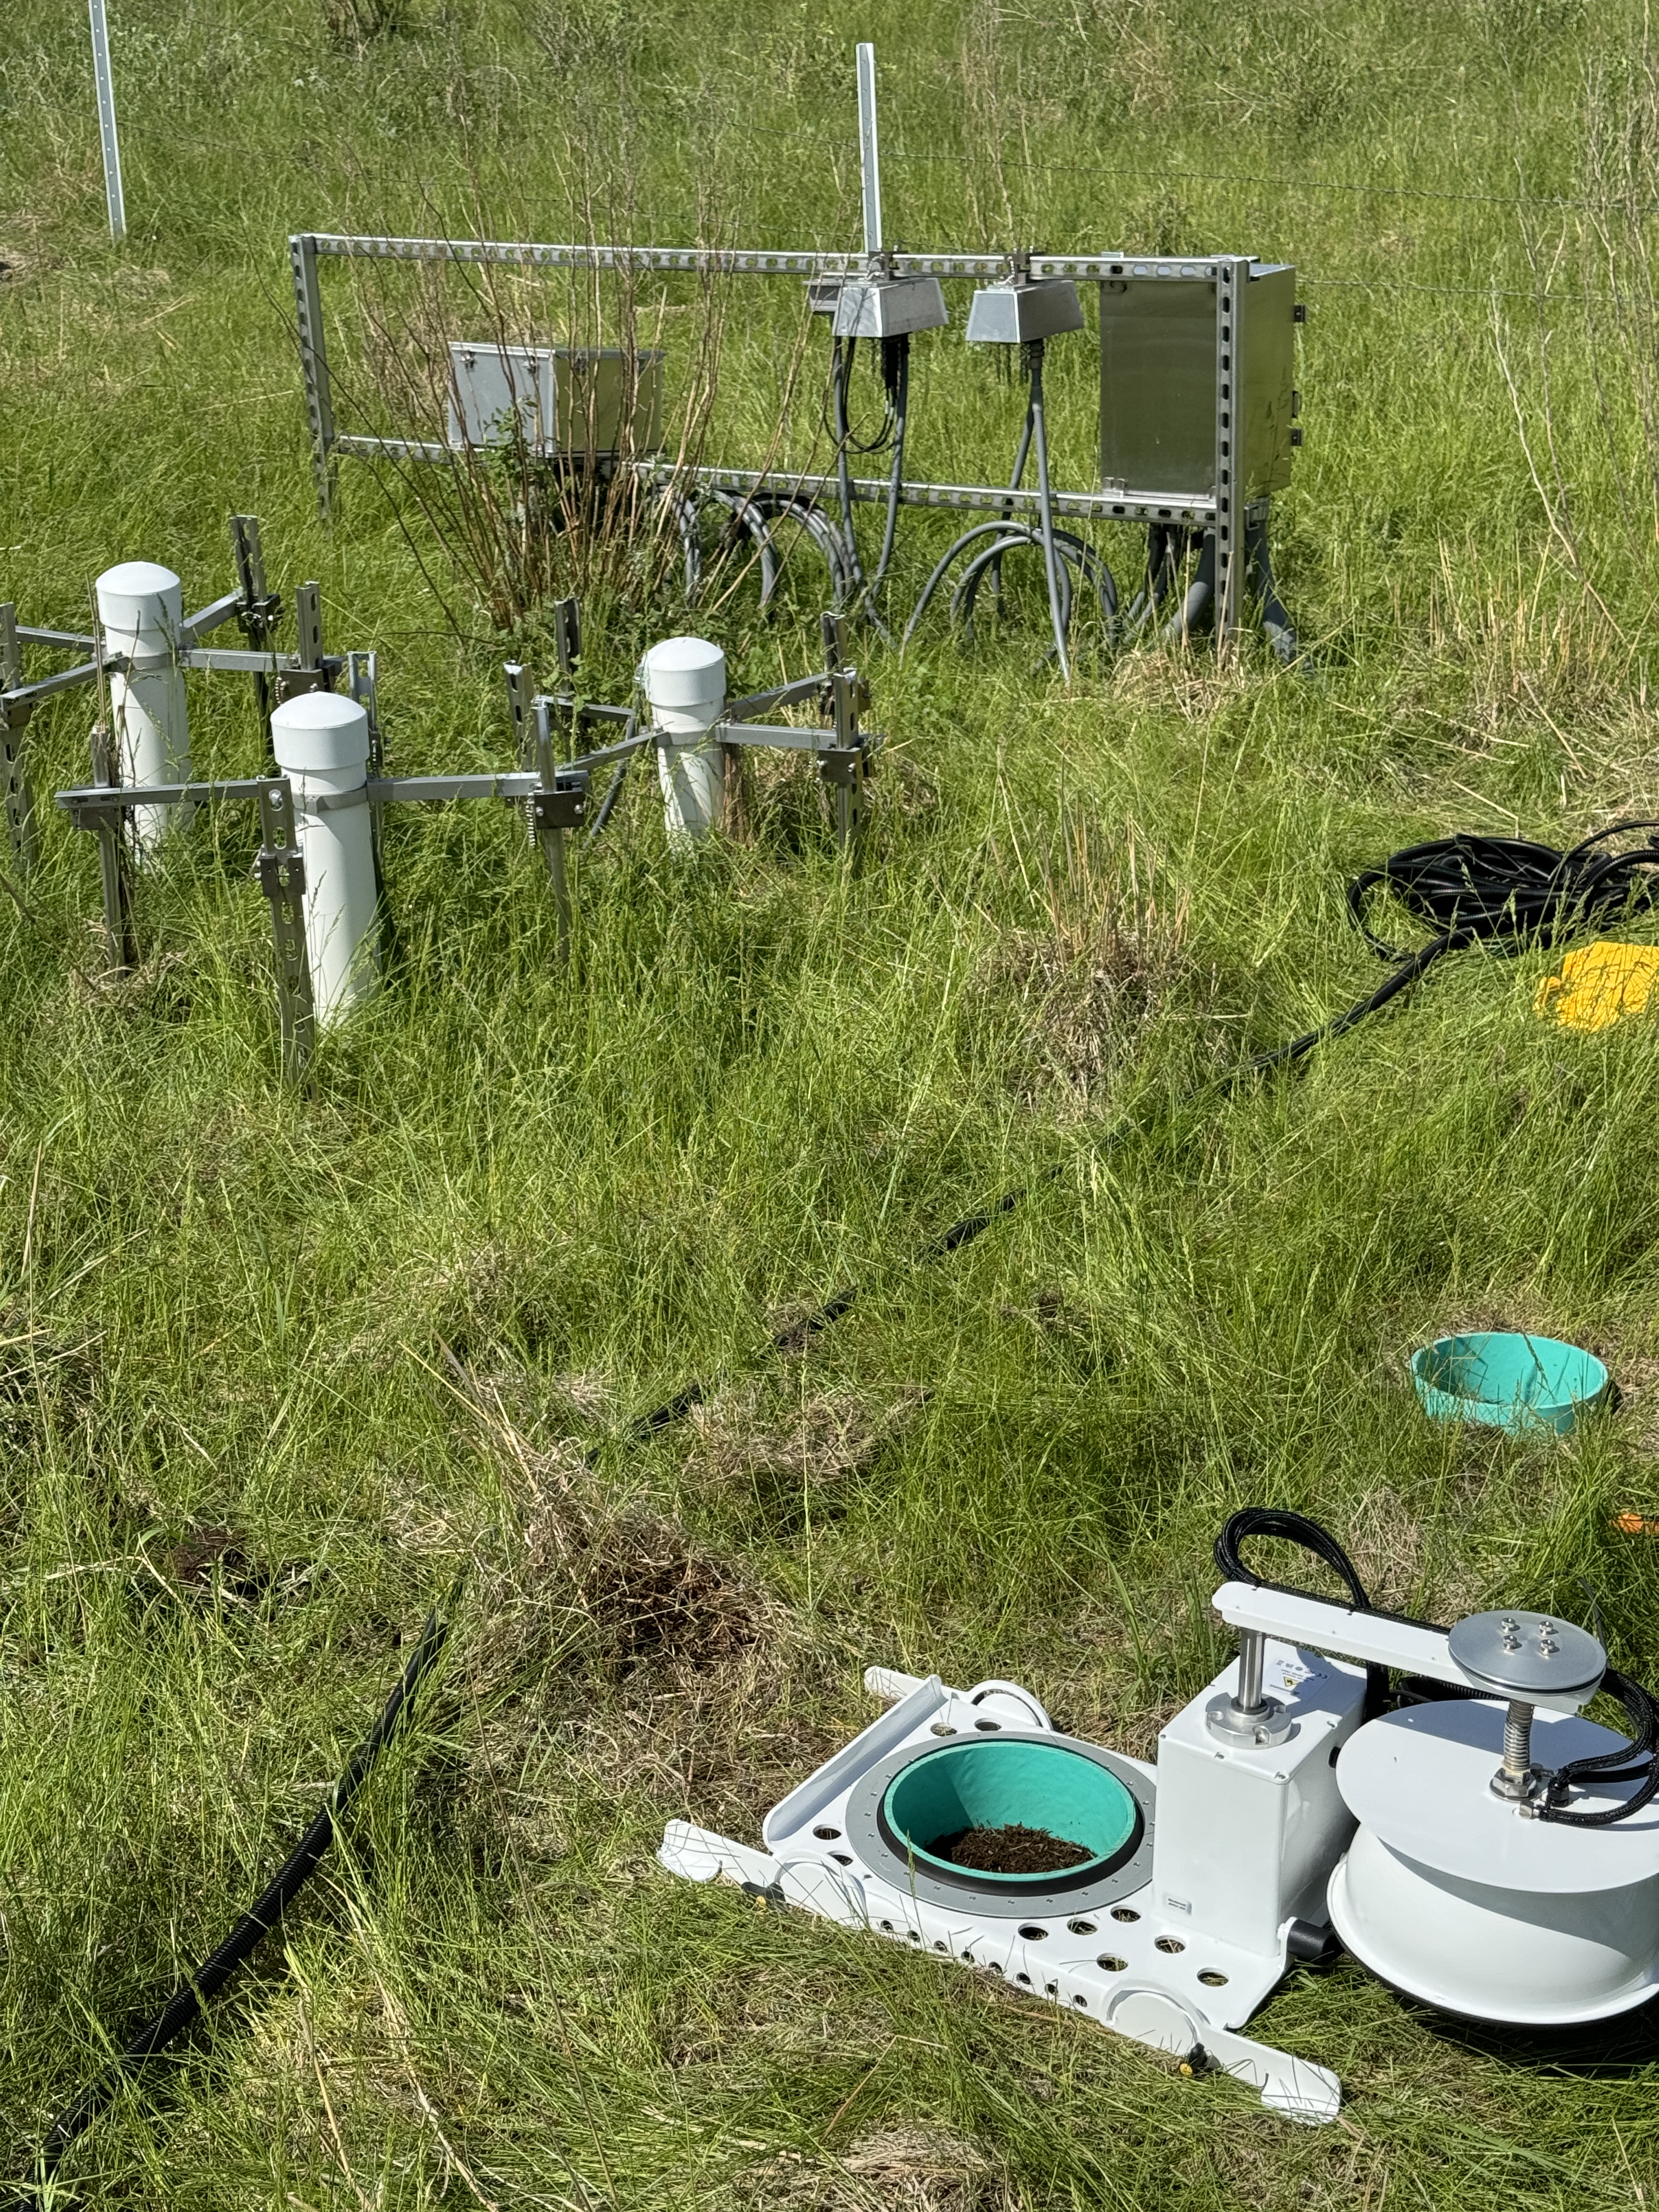
That kind of data is the perfect launchpad for tackling big topics, like examining changes in soil carbon across diverse ecosystems in the context of a changing environment. Soils hold about half of all terrestrial carbon. Measuring how much soil carbon later leaves the soil to enter the atmosphere (the “flux” of gaseous CO2) is tricky. Historically, researchers have generally relied on automated chambers or manual periodic sampling of fluxes using soil collars (sections of cut PVC pipes hammered into the ground to enable sampling of gas flux from a defined soil surface area). Using chambers or collars across dozens or hundreds of sites year-round would be prohibitively expensive and would require intensive field work, both of which drive this approach out of the realm of possibility for many teams of researchers. Another approach that has been used to characterize soil CO2 flux is estimating it from a suite of environmental sensors making continuous measurements at different depths in the soil. This hands-off approach enables continuous (instead of point-in-time) estimates of flux rates, but it can be a bit tricky to parameterize the estimating equations properly.
So, we set out to use one of these approaches to tackle the other. Specifically, our recently published study in MEE, neonSoilFlux: An R package for continuous sensor-based estimation of soil CO2 fluxes, used field-collected flux data to help parametrize and validate an R package that computes estimates of soil carbon flux from NEON soil sensor data. The package produces a soil flux estimate by combining existing data streams collected by NEON across all of its terrestrial sites: soil CO2 concentrations, soil temperature, soil moisture, and other measurements. This project, funded by the National Science Foundation (NSF awards 2017829 and 2017860), focused on building a defensible baseline soil flux product for NEON sites. We hope such a product will prove useful in the community as another resource alongside existing databases of soil carbon flux measurements, such as the Soil Respiration Database (SRDB) and the Continuous Soil Respiration Database (COSORE).
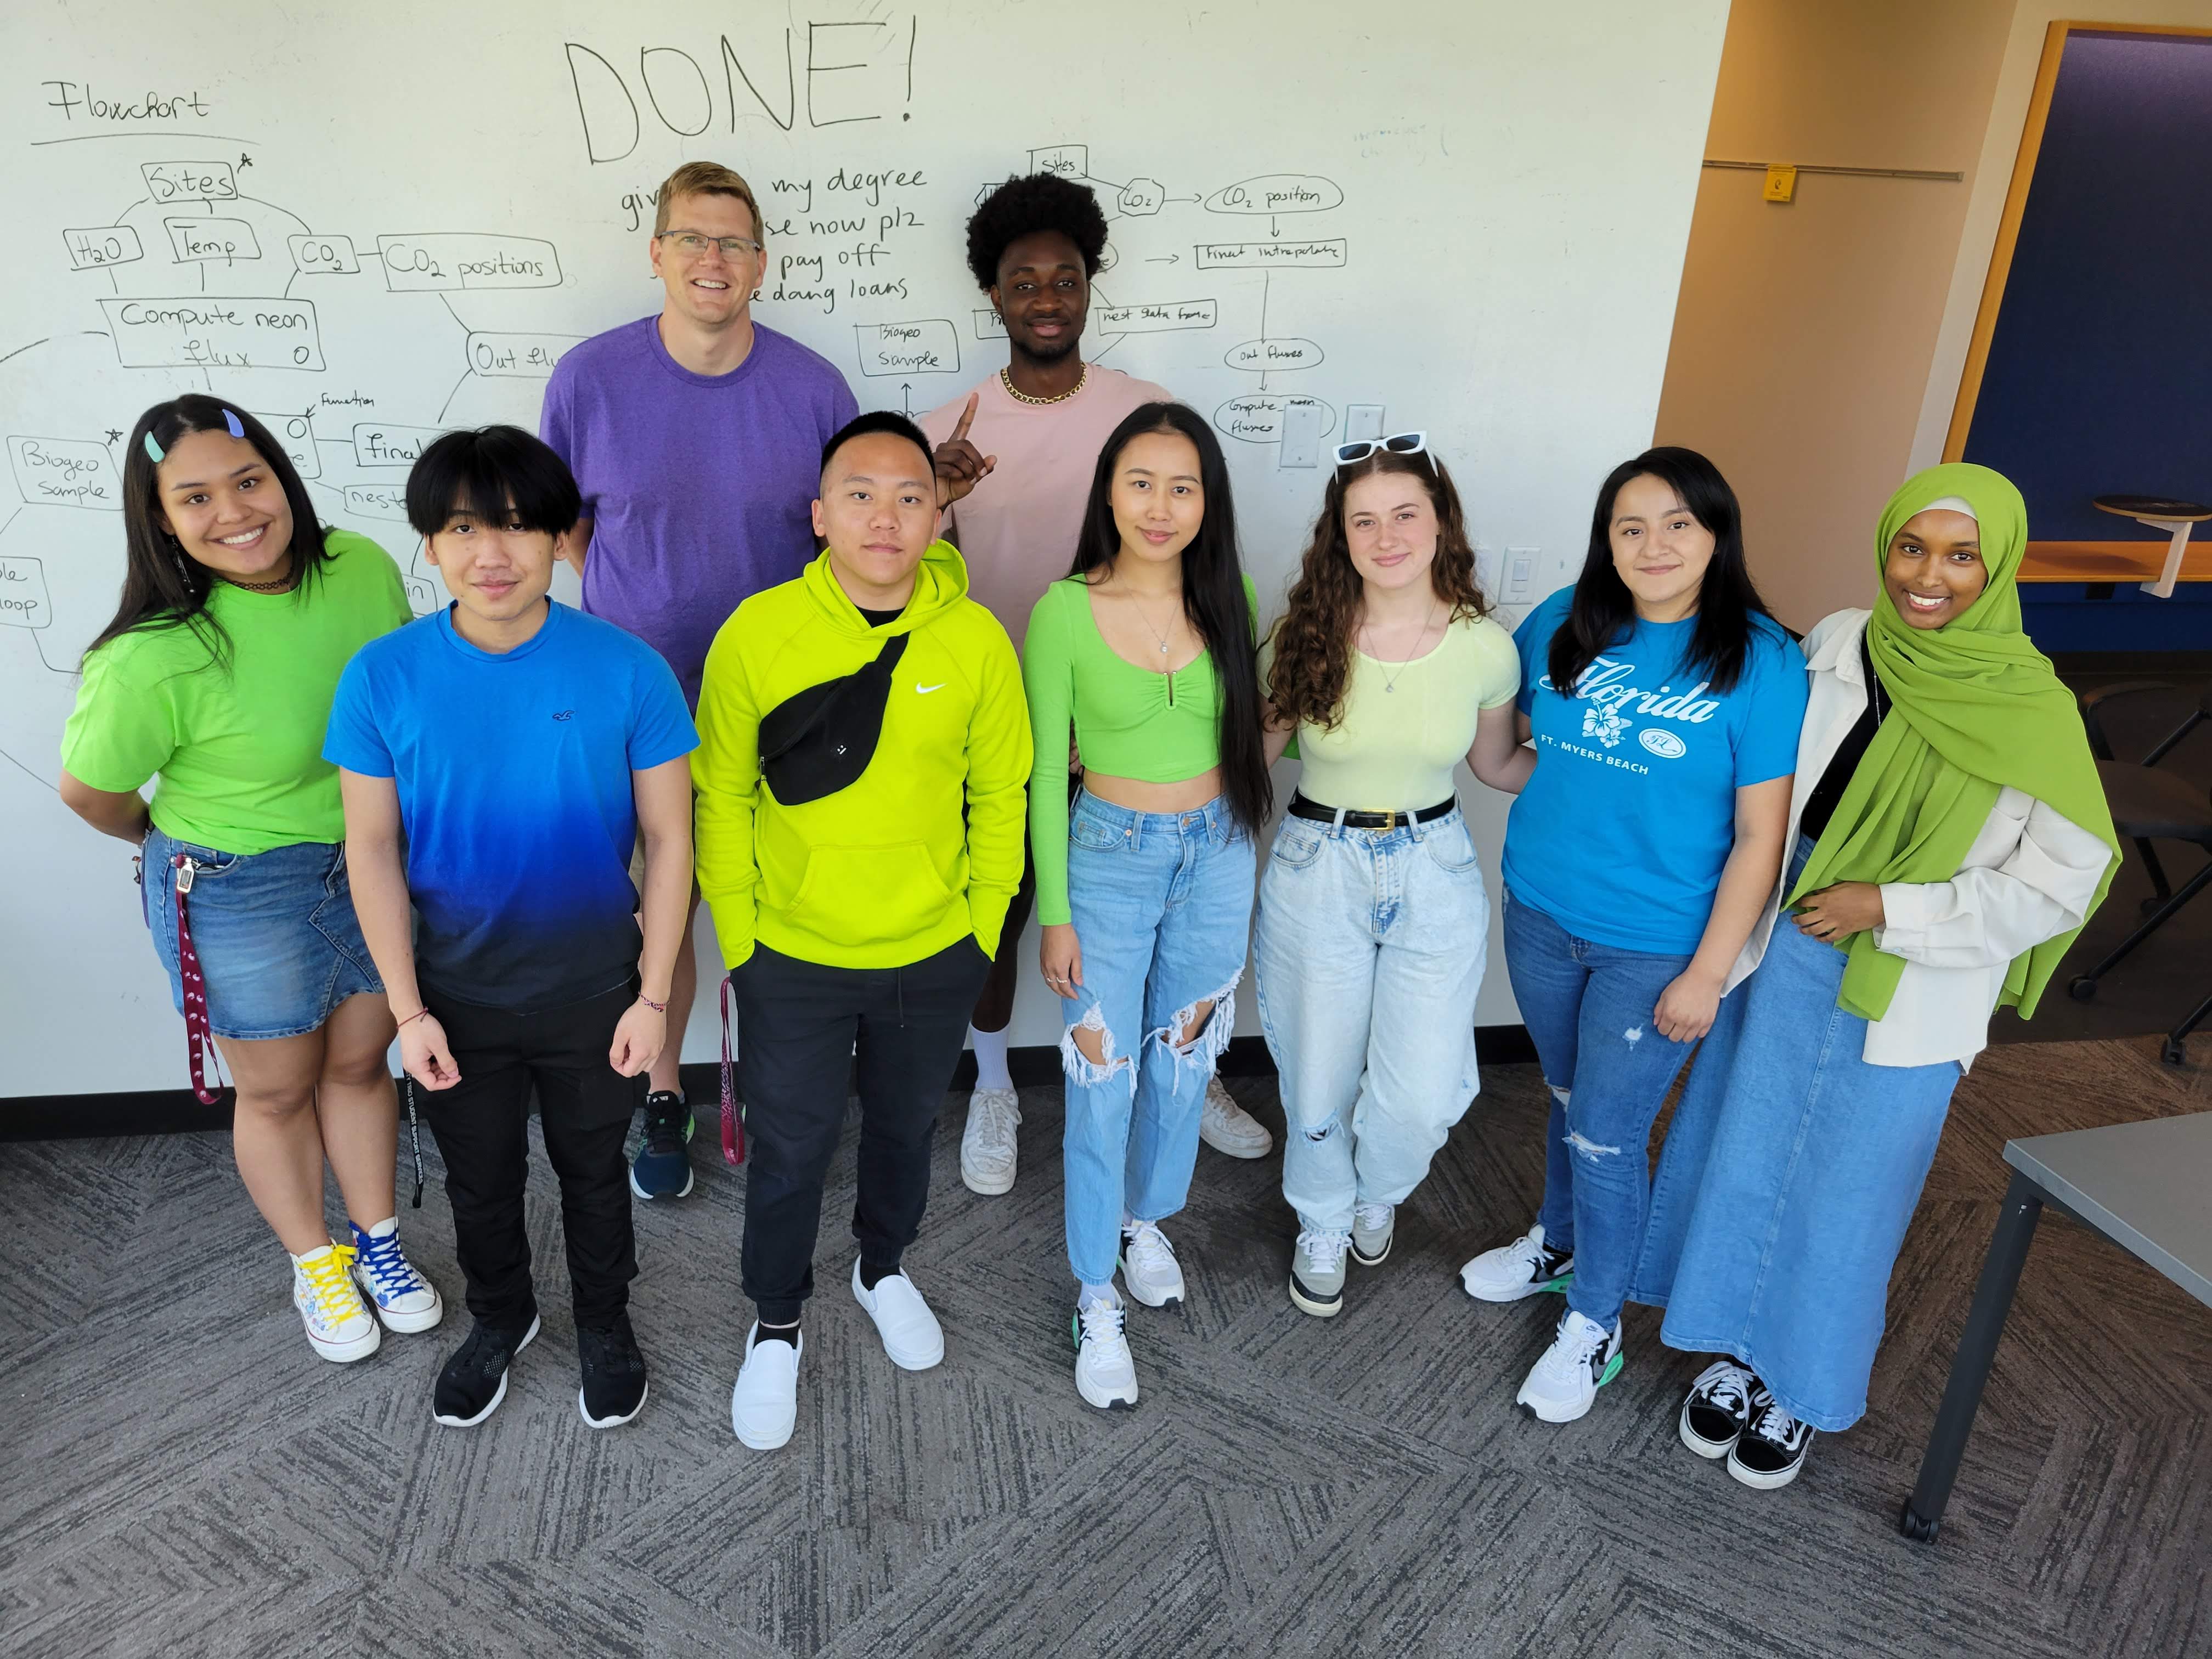
There were two interconnected fronts in this effort. The first involved lots of coding and the second involved lots of field work. Our co-author, Ed Ayres, had sketched out some foundational code in R that applied Fick’s Law to compute soil fluxes from NEON sensor data. Our initial task was taking this code and turning it into an accessible R package. This was less about writing new code and more about structure. We broke the entire process down into three main modules: first, acquiring the raw data from the NEON API; second, harmonizing the various data formats; and third, computing the estimated fluxes. Within those modules, we then created small, single-purpose functions: including one for unit conversions, one for computing diffusivity, as well as many others as needs arose along the way. Modularizing the code allows us to provide easy updates to the package. John led this effort to develop and test the code, guiding a team of undergraduates at Augsburg University through the ins and outs of scientific software development.
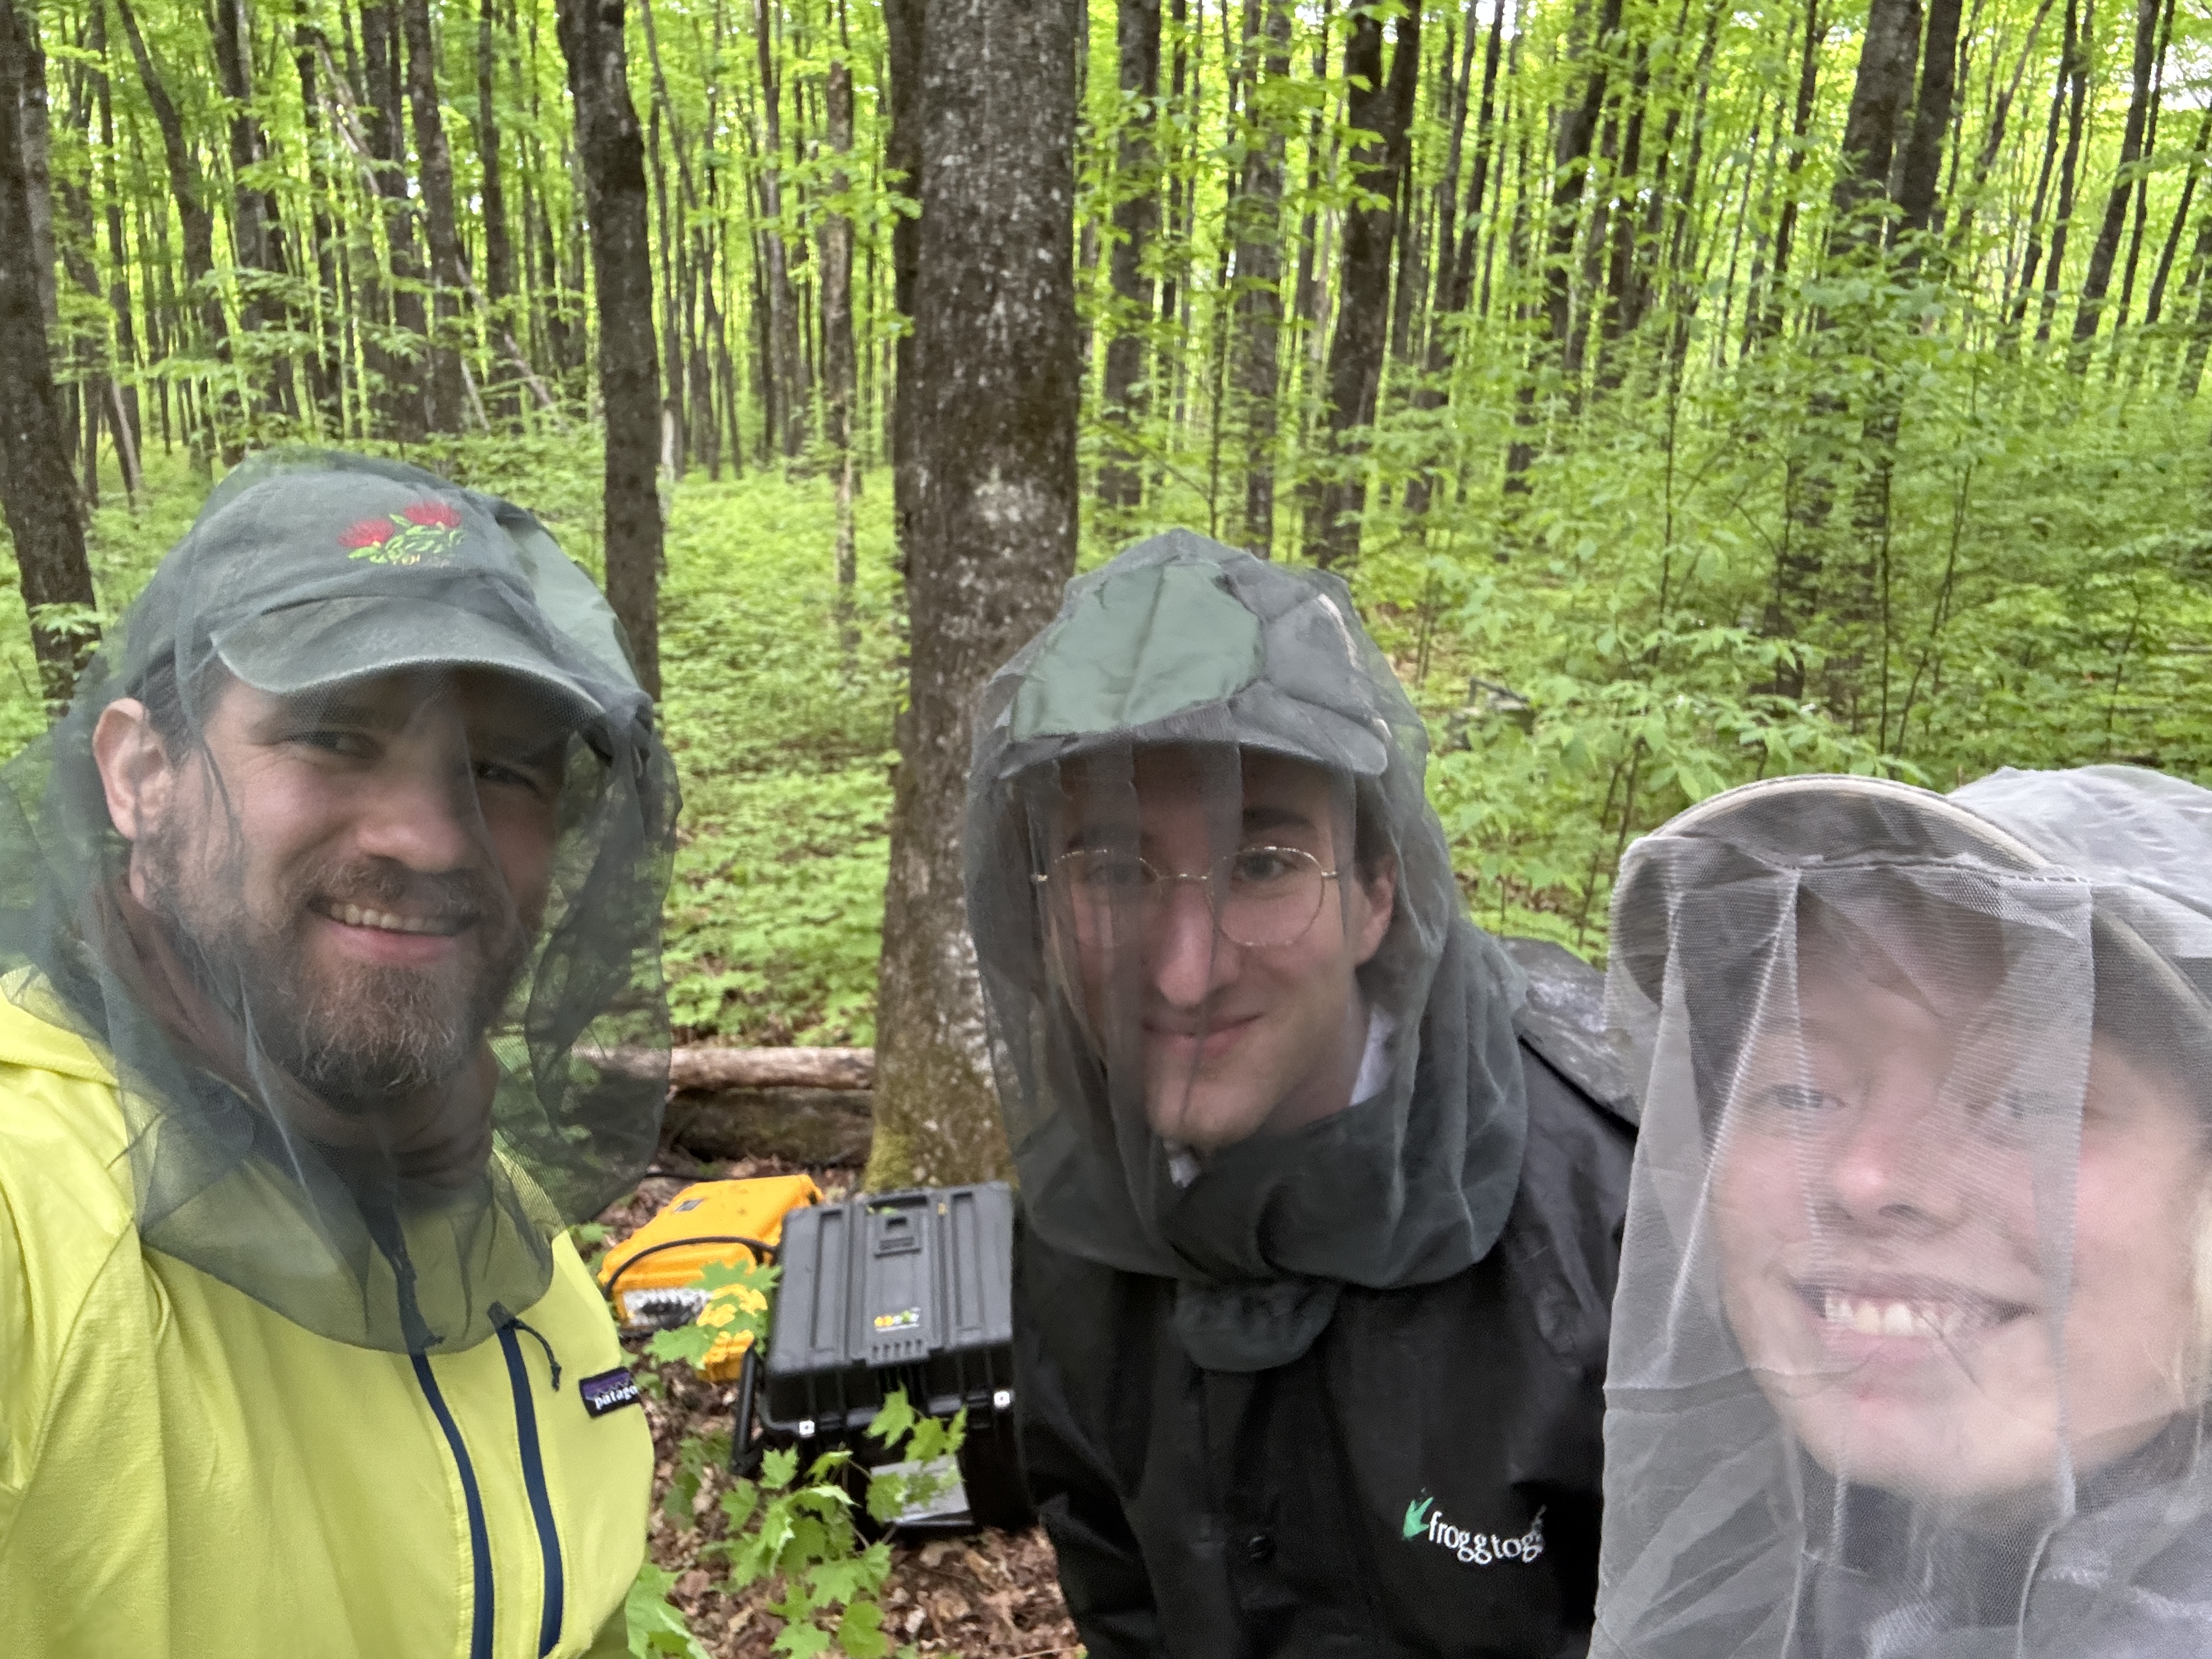
The second front in the effort was to validate the sensor-based computational predictions of flux against on-site empirical measurements of flux in the real world. This required field work at six core NEON sites in the western and midwestern continental US; this effort spanned multiple years and some truly epic road trips. Naupaka led this effort with teams of undergraduates from the University of San Francisco. Conducting field work at even a single site is frequently challenging, between juggling equipment transport, unpredictable weather challenges, permitting, swarms of biting insects (a.k.a. real life debugging), and myriad other logistics. Conducting the field work across six sites in six states gave us an even stronger sense of gratitude and appreciation for what organizations like NEON provide to the public for free.
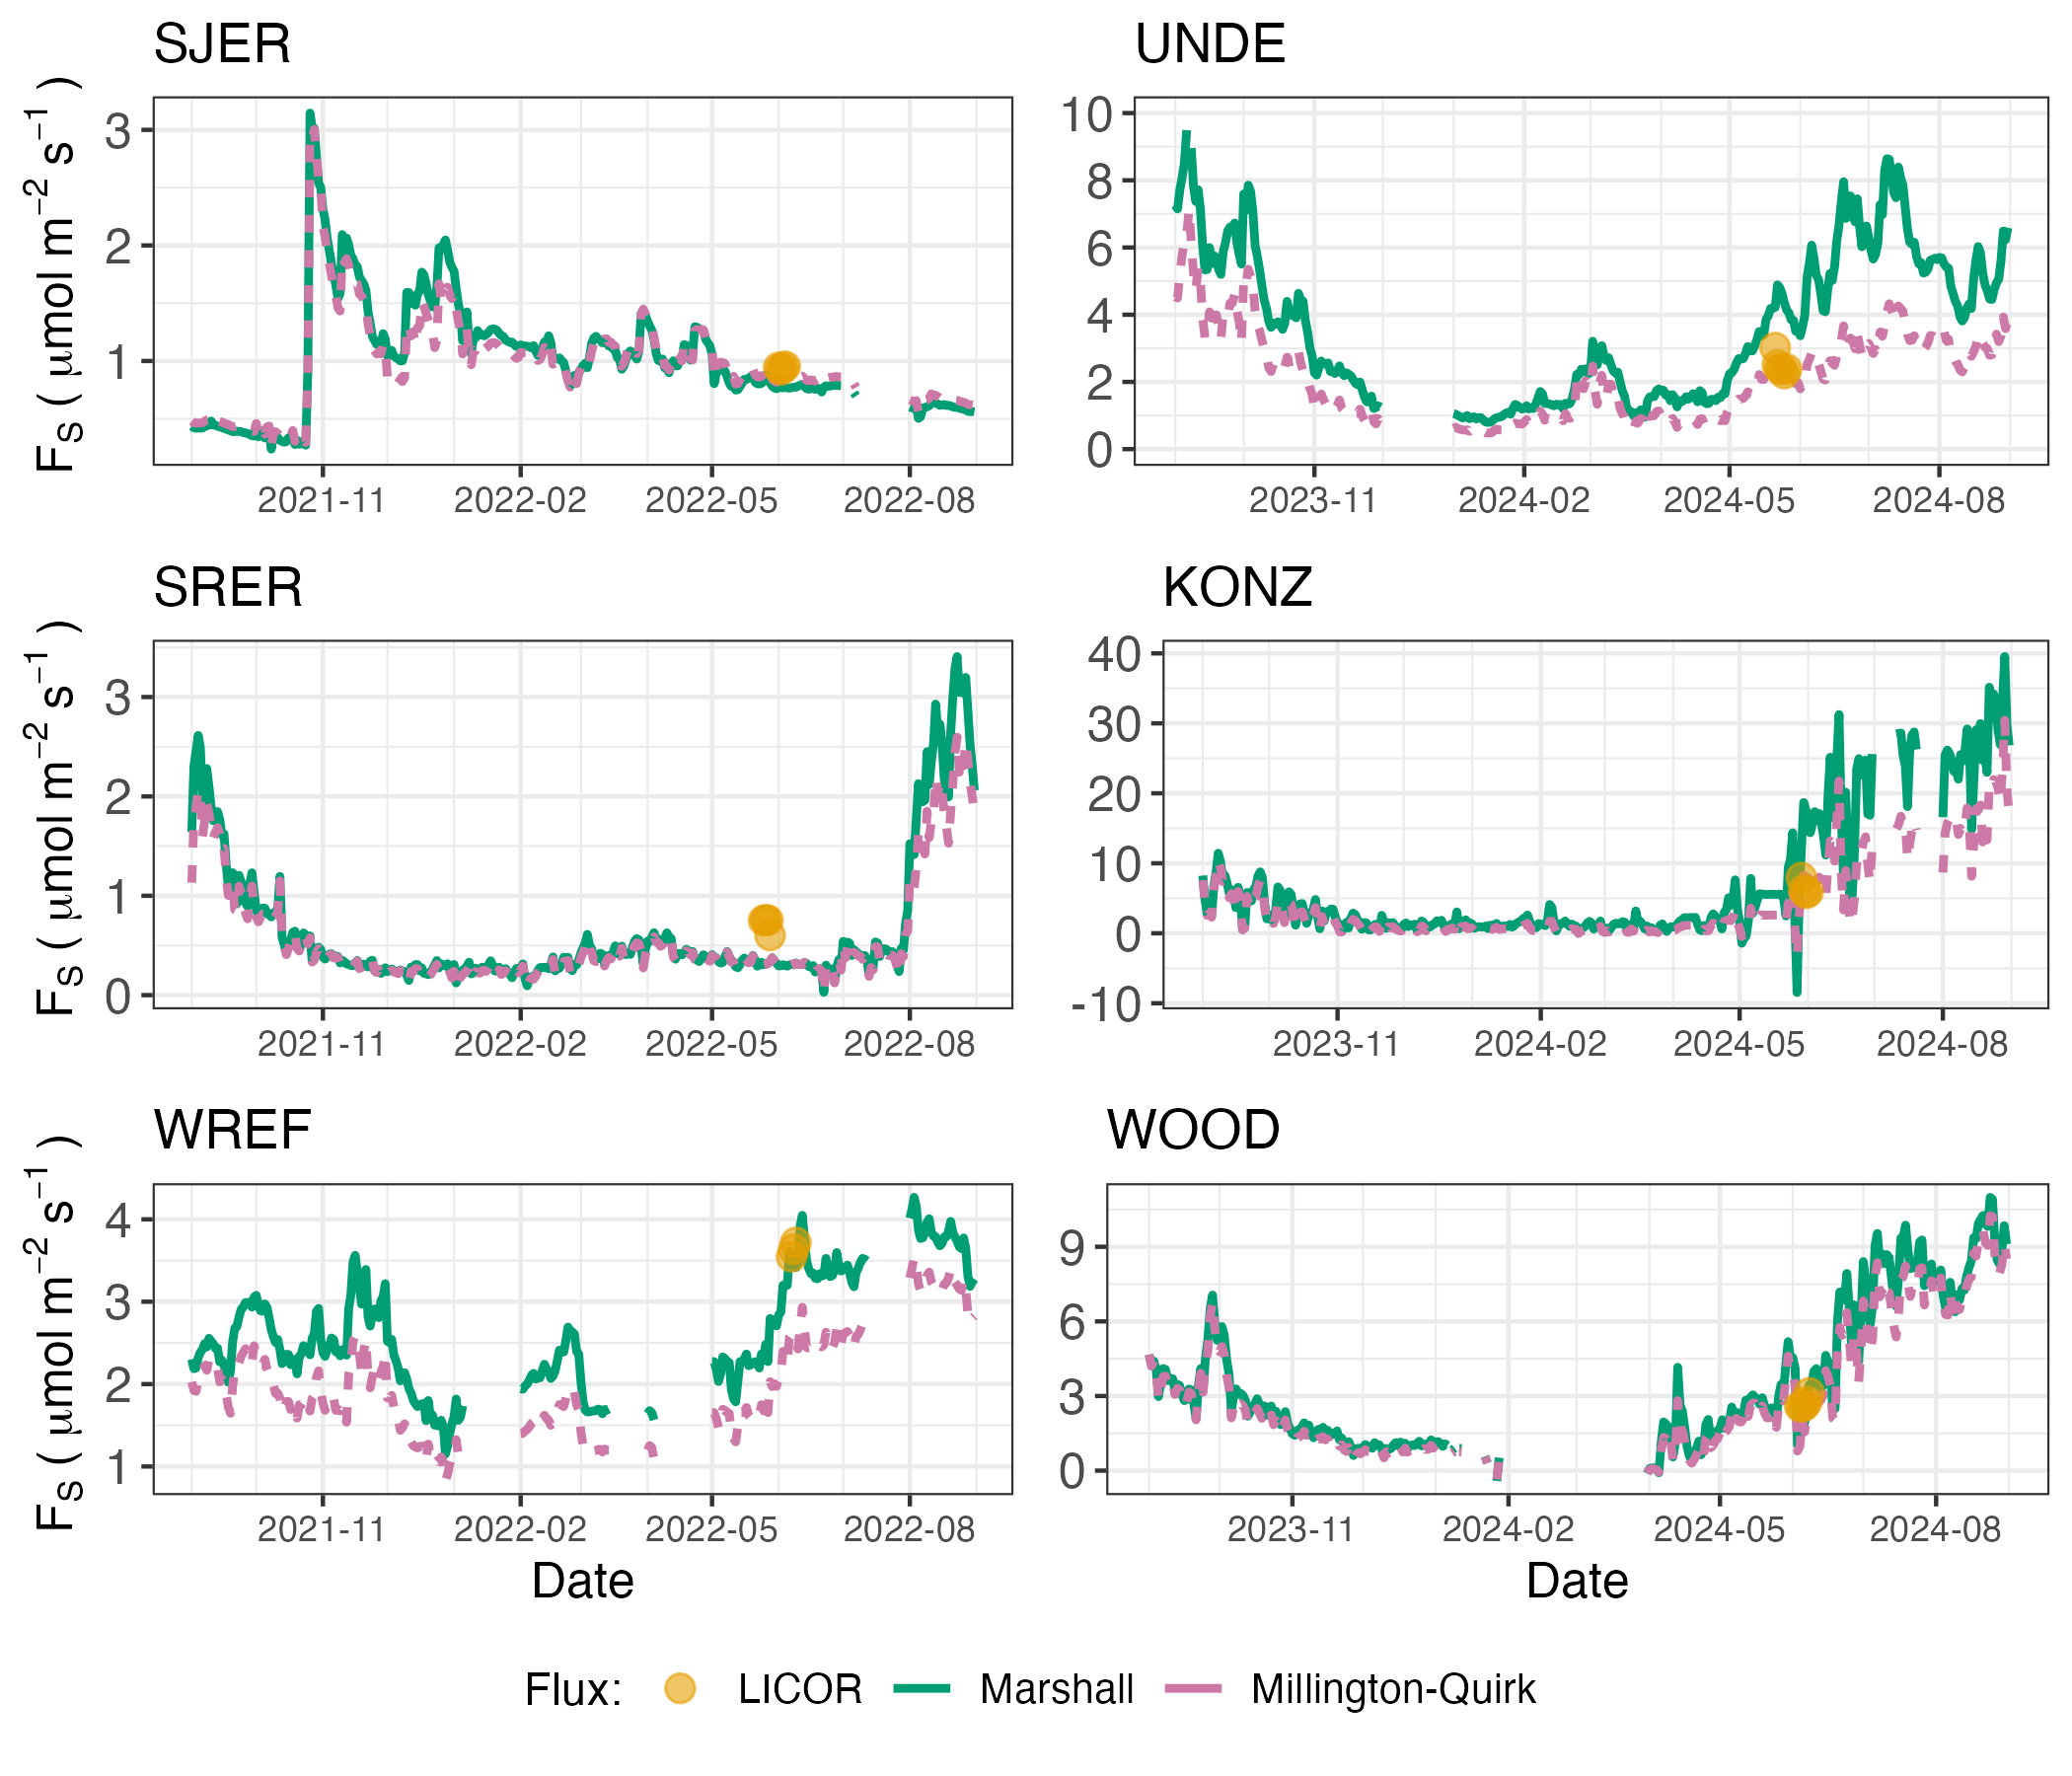
With the hard-earned field data in hand, we then focused together on comparing the two sets of flux estimates (sensor-based and manually field-measured) at each site. We spent many months debugging, checking parsing errors, and wrestling with soil water content QC flags. While it would have been nice (although perhaps a bit suspicious) to have perfect agreement between both approaches, the most interesting ecological insights from this project came from the sites and times where the two sets of data didn’t agree.
As we dug in further (hah!), we found that two sets of things matter quite a bit in determining how well the modelled fluxes matched those measured in the field. The first is choosing the particular soil sensor depths to use for estimating surface flux (e.g. all three depths of soil sensors or only the bottom two depths, etc). The second is choosing how soil diffusivity is estimated at each site. The field data showed us that instead of a blanket approach, the user would need flexibility. So, instead of just calculating a single estimate of flux for a given site and time, we redesigned the package to calculate a suite of flux estimates, enabling the user to select the one that is likely to work best for a given site or to aggregate across them to provide an ensemble estimate if they prefer.
The primary lesson we learned from this project? The same thing that we hope students learn when they take on a scientific challenge of their own for the first time. That the cases where the model doesn’t match the data are often where the most interesting scientific insights are hiding. That the iterative (and yes, often emotionally challenging) process of testing and refining hypotheses against measurements taken out in the real world can both teach us new things about how the world works, and also be intellectually satisfying in a pretty special way.
The package is available on GitHub and on CRAN, and the article is available from MEE with an open access license.
