
Post provided by Benoît Pichon
When I first started working on dryland ecosystems in my PhD, I didn’t expect to spend quite so much time staring at black-and-white aerial photographs. Yet these simple images—pixels of vegetation scattered across a matrix of white bare soil pixels—hold fingerprints of the resilience of drylands. In this work, we developed an approach to learn about dryland resilience from vegetation patterns and to pinpoint sites at higher risk of desertification. What we found is that even a single snapshot of vegetation can reveal how close a site might be to its desertification.
Importance of drylands
Drylands cover more than 45% of Earth’s land surface and support hundreds of millions of people. But they are also vulnerable to degradation, which can happen rapidly when drylands cross thresholds beyond which drylands’ functioning and structure change critically. Our goal was to understand whether we can identify sites with lowest resilience—how far they are from a threshold, and how vulnerable they may be to future changes—using a snapshot of their spatial patterns. These spatial patterns emerge from positive plant-plant and plant-soil interactions and change in predictable ways with aridification. They therefore provide fascinating fingerprints of dryland resilience.
Building our methodology
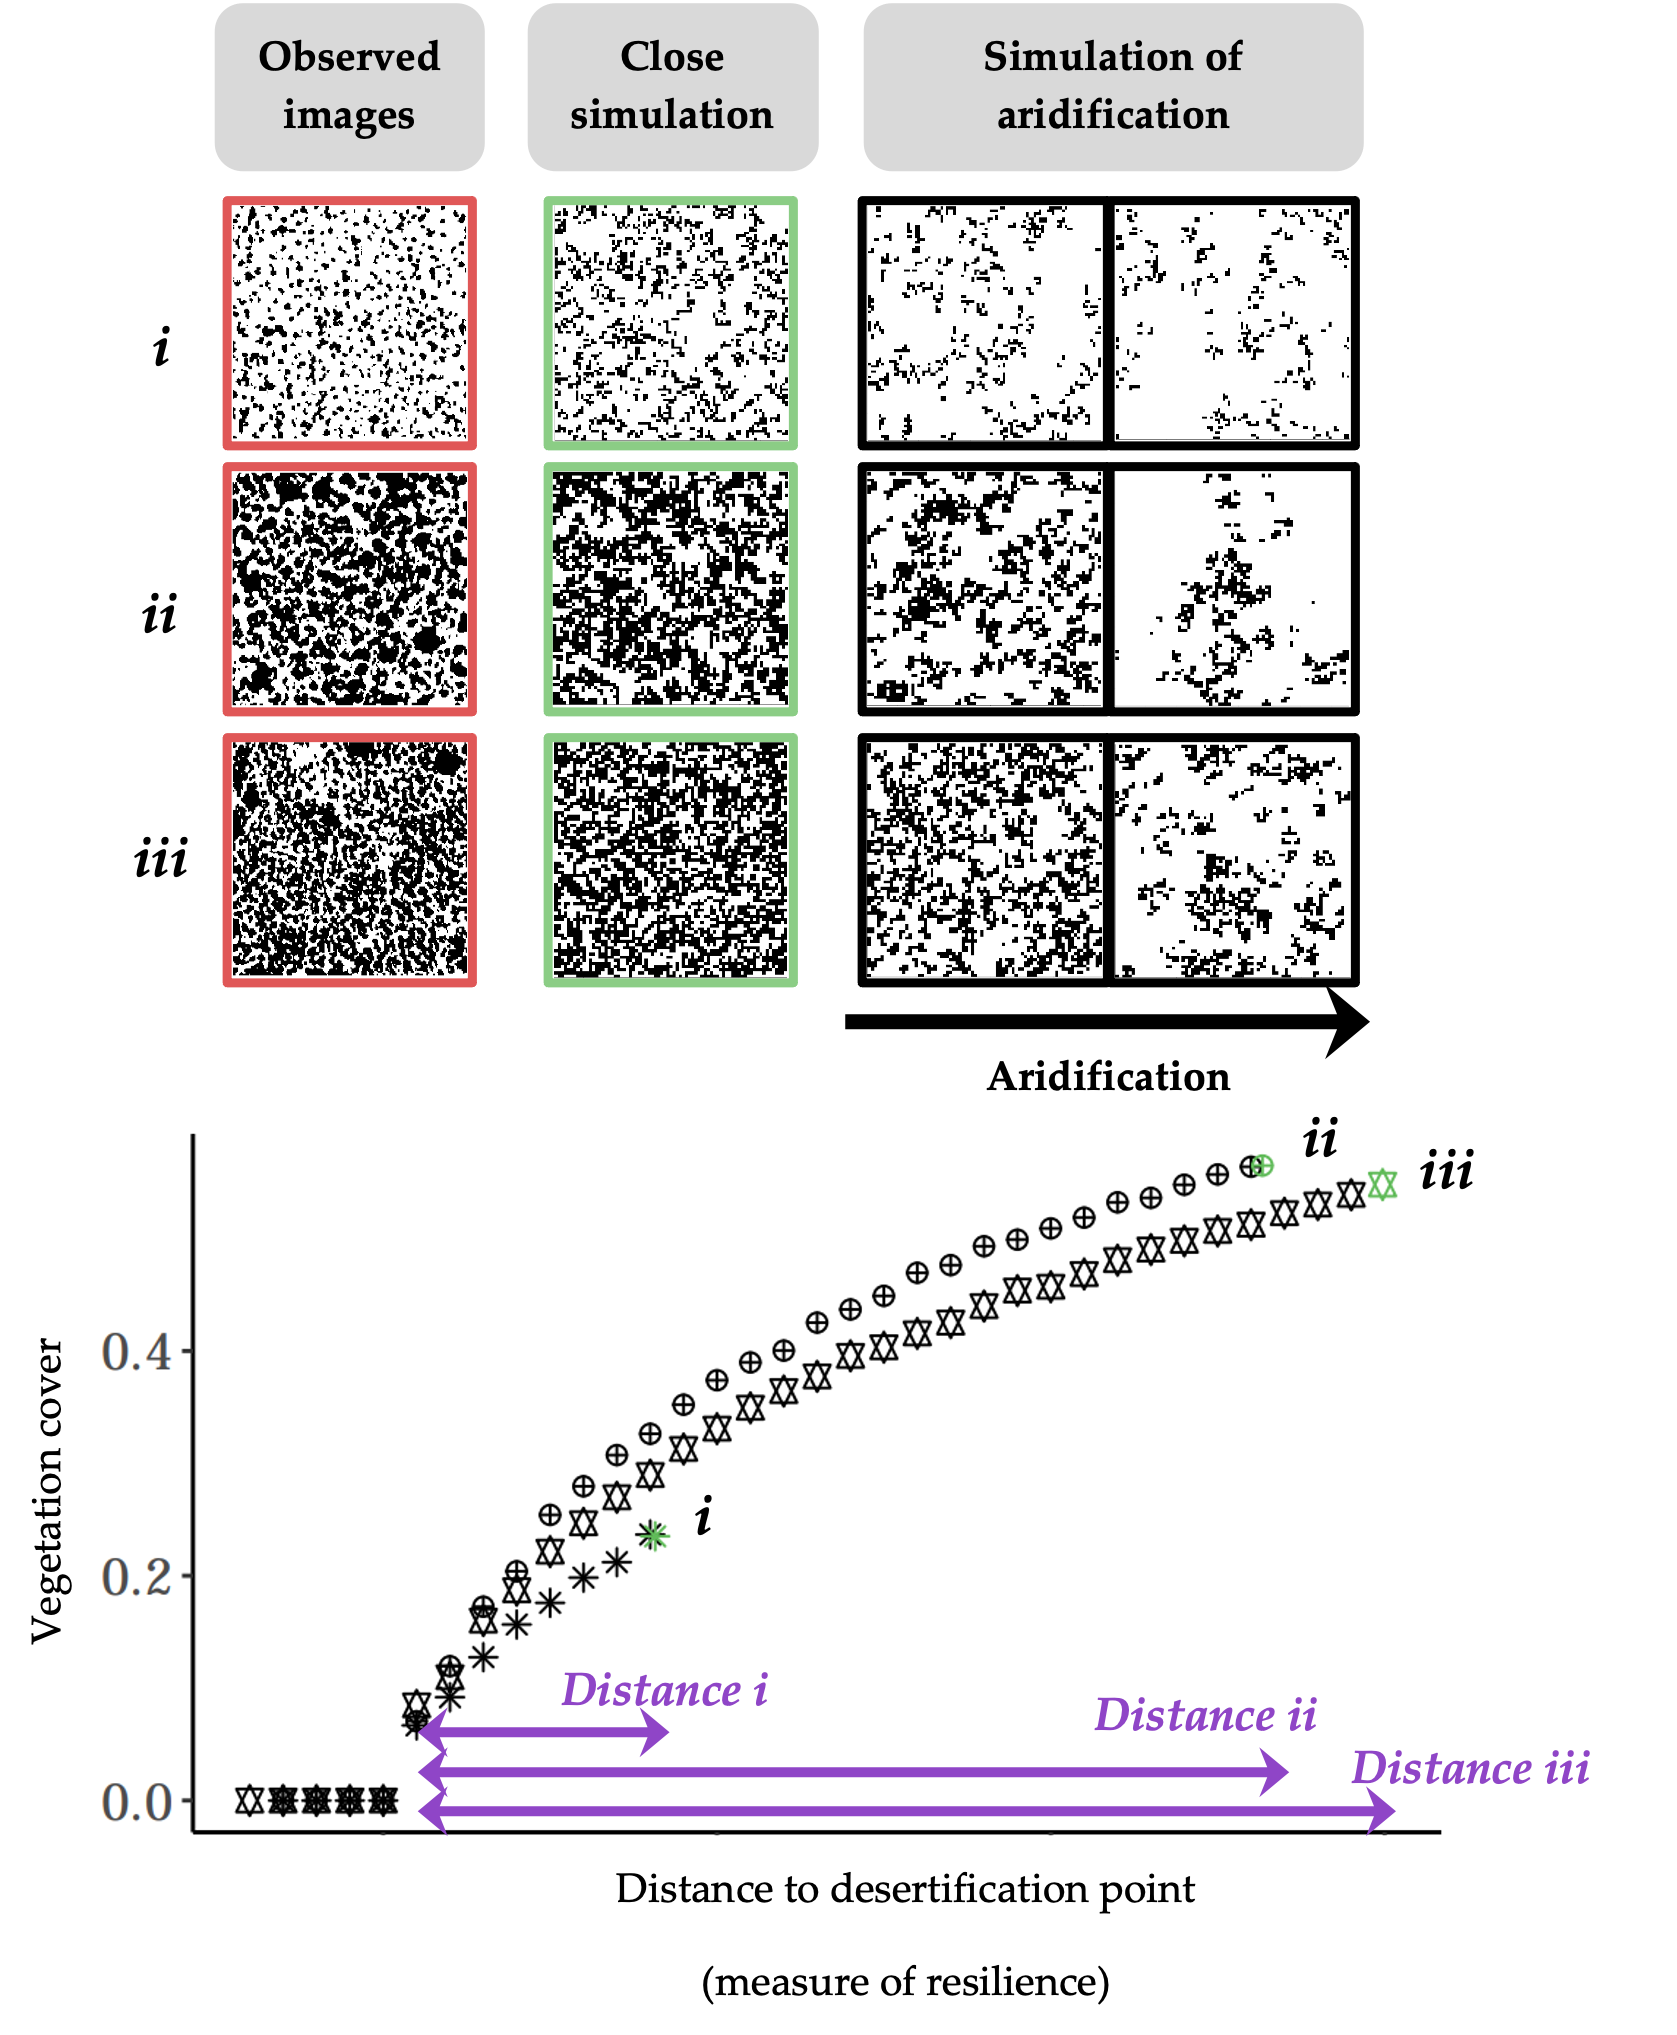
Instead of working only on satellite images of drylands, our idea was to use a very simple ecological model that can produce landscapes with vegetation and bare soil, just as in the observed images. The model accounts for two basic ingredients of plants in drylands: their ability to reproduce or disperse locally and their ability to cluster through facilitative interactions. Although simple, this model can produce realistic dryland patterns and respond to increasing stress in similar ways as observed on images.
The next step was to work backwards from real images. We used a method called Approximate Bayesian Computing to infer the most likely model parameters that could have generated each observed landscape. This allowed us to translate the spatial structure of each site into a common language: how much reproduction and facilitation would be needed to produce the observed pattern?
Once we had these estimated parameters, we could then mimic aridification of our site by gradually increasing ecological stress in the model until desertification occurs. The distance between the site’s estimated state and this desertification point is our measure of resilience (see figure below).
Linking resilience to future climate risk
Estimating the resilience of current landscapes was only half the story. Drylands are experiencing aridification at different speeds across the world, so the other half was understanding how quickly their environments are changing. By combining our resilience estimates with climate projections, we could identify sites that are both close to their desertification point and expected to experience rapid increases in aridity over the coming decades.
Looking ahead
For us, one of the most exciting parts of this work is its simplicity. With only a single aerial image and a modelling framework, we can begin to map ecosystem fragility across vast areas. Complementary to long-term monitoring, it offers an easily implementable approach for future work aiming at mapping ecosystem resilience at large scales.
Altogether, staring at dryland images may seem like a strange way to understand desertification, but vegetation patterns are powerful storytellers: the shapes and spacing of plants give us a clear picture of drylands’ fragility.
Read the full article here.
