Post provided by Matthew Ramirez, Alexi Besser, Seth Newsome, and Kelton McMahon
The cover of our October issue shows a katydid feeding on a leaf in the Tirimbina Rainforest National Wildlife Refuge of Costa Rica. Once digested, nitrogen from the leaf is incorporated into the katydid’s tissues in the form of amino acids, with slight modification to their stable nitrogen isotope values (δ15N). In this post the authors discuss the importance of understanding and accounting for variability in primary producer amino acid δ15N values when characterizing where consumers are positioned within food webs, detailed in their Methods in Ecology and Evolution article “Meta-analysis of primary producer amino acid δ15N values and their influence on trophic position estimation.”
Quantifying Consumer Trophic Positions
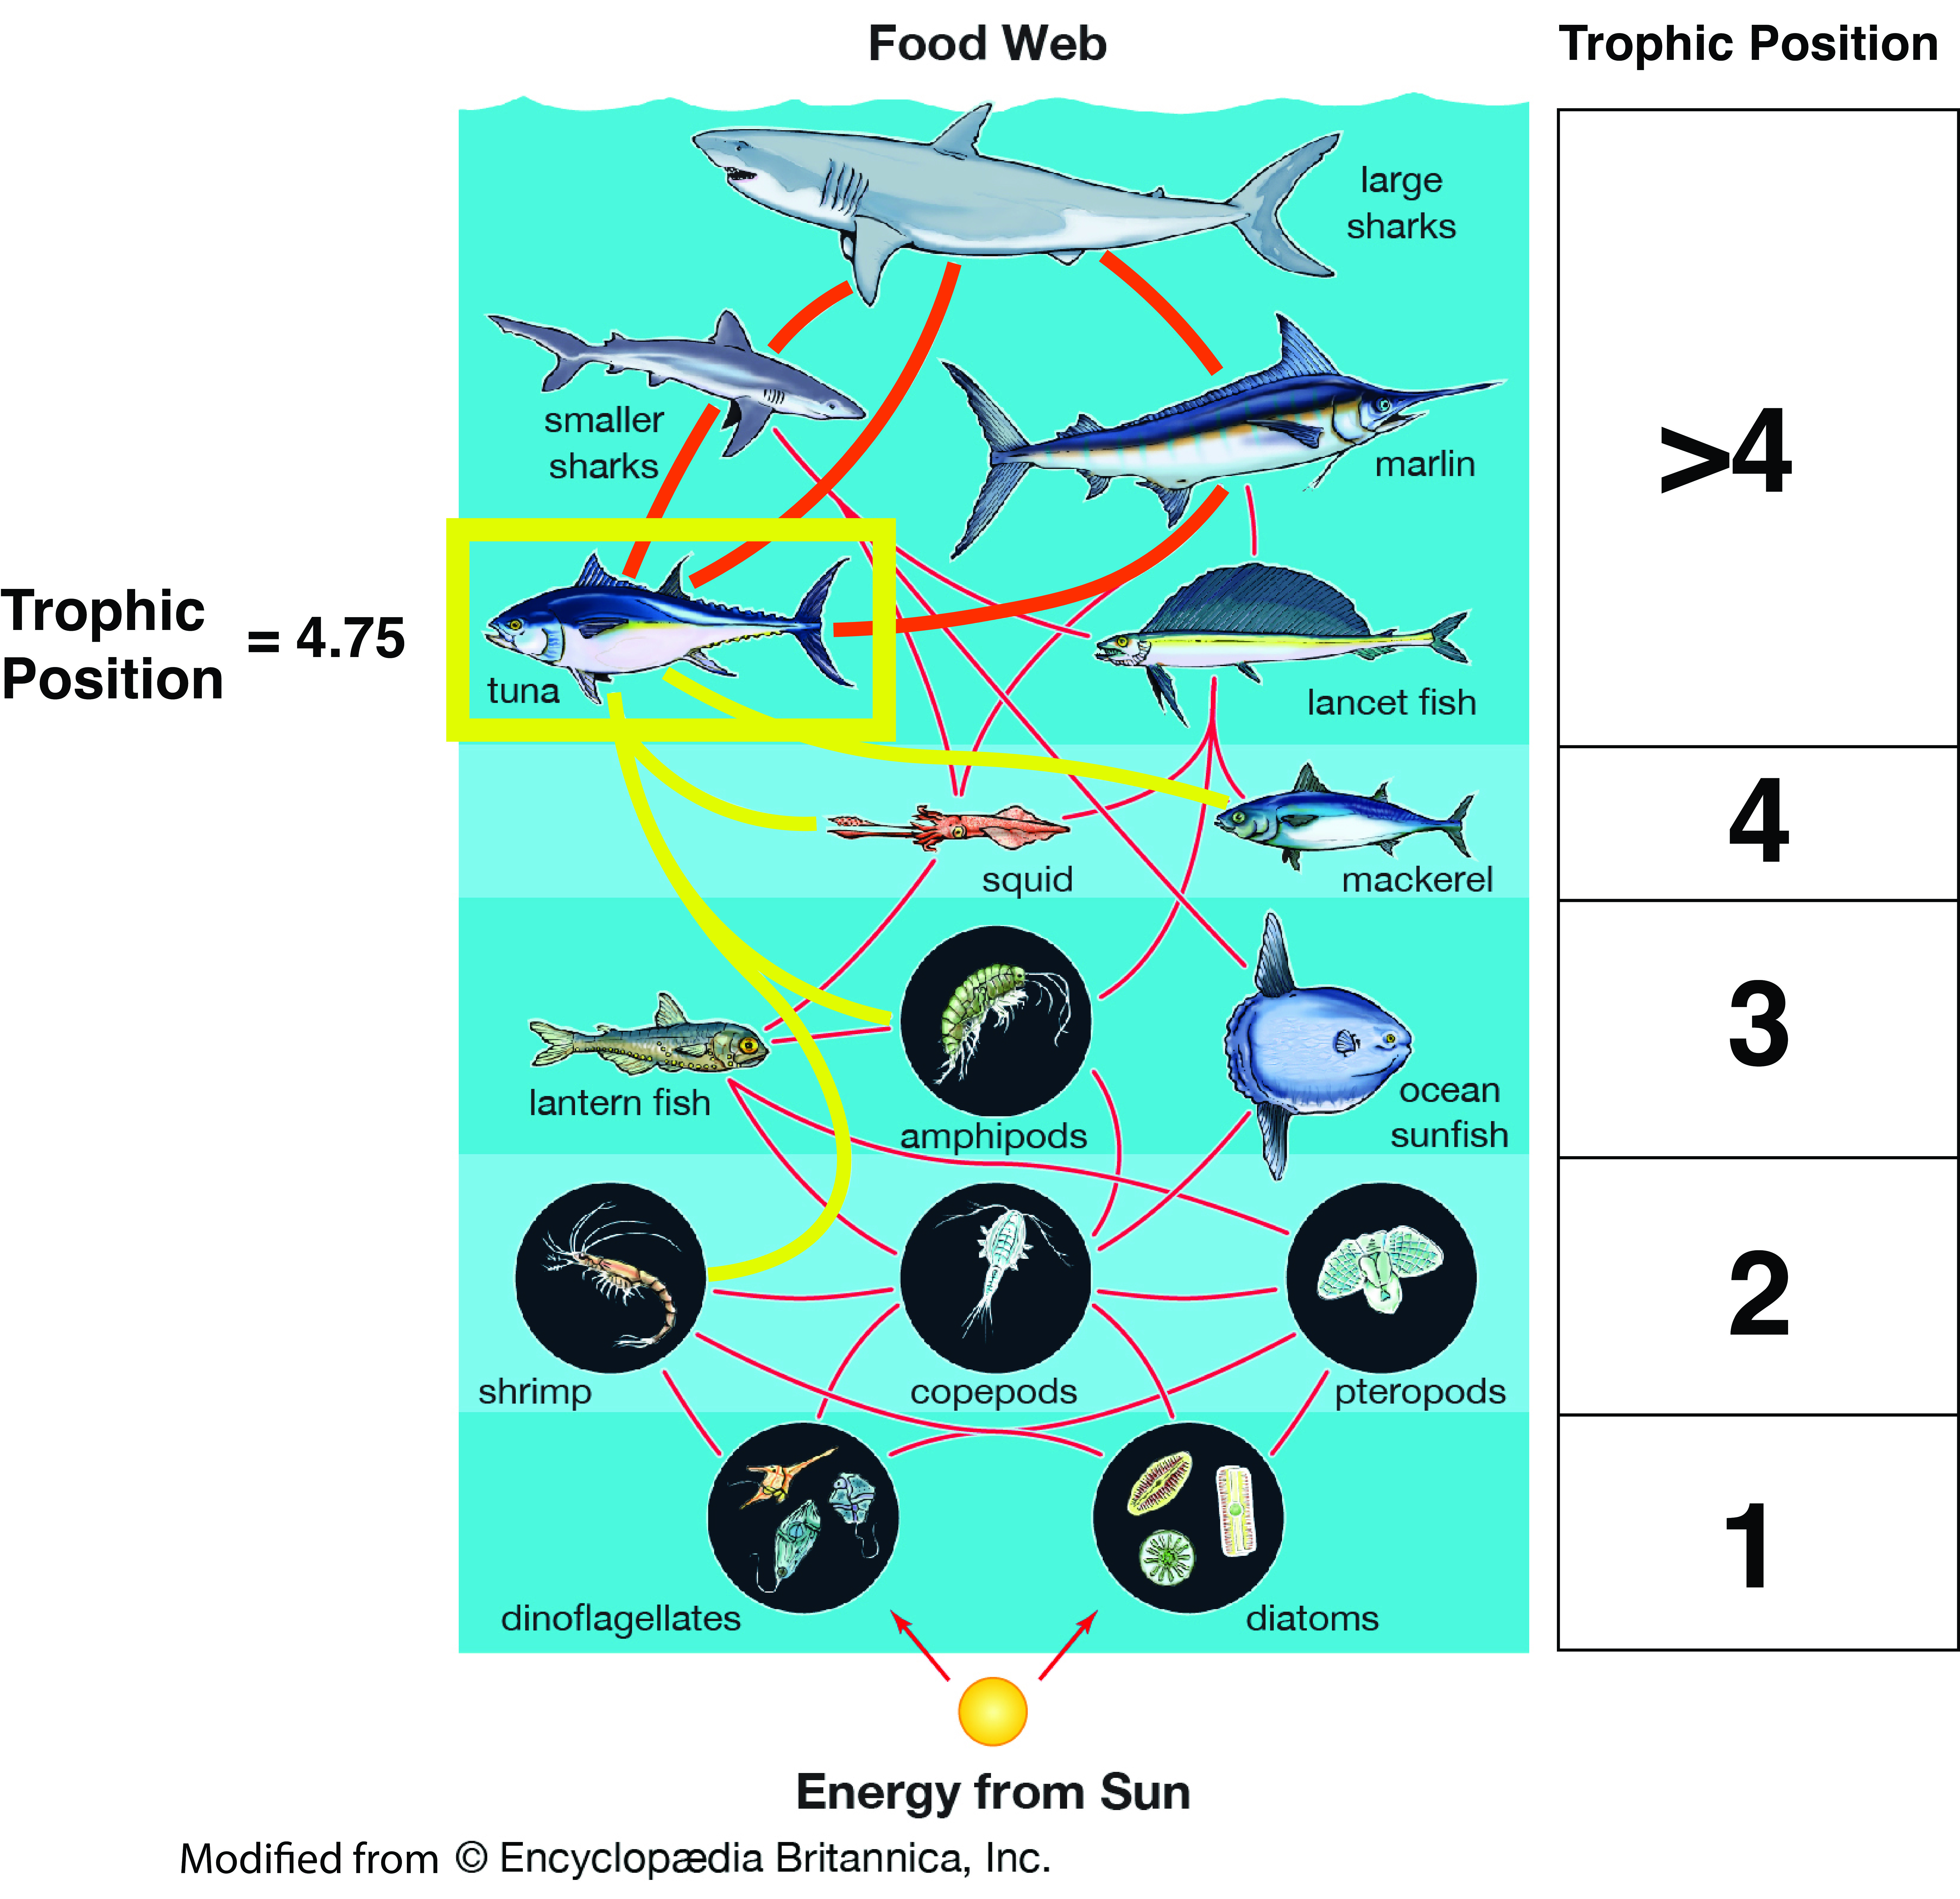
Food webs are complex networks of feeding links that describe who eats whom in an ecosystem. Where an organism falls within this interaction network defines its trophic position (or trophic level). Because organisms often forage at multiple levels in the food web (e.g., tuna eating squid, small fish, and shrimp), trophic positions are often not simple integers. Ecologists have long been interested in quantifying consumer trophic positions as they provide a simple metric for studying species interactions and community structure and function.
CSIA-AA: a Transformative Tool
Over the past decade, compound-specific stable isotope analysis of amino acids (CSIA-AA) has emerged as a valuable new tool for quantifying consumer trophic positions . CSIA-AA extracts unique metabolic information from individual amino acids to provide insights on the trophic ecology of consumers (i.e., what they eat) and the baseline isotopic composition of primary producers at the bottom of the food webs in which they feed. The latter is a key source of variability that can influence trophic position estimates but that is often difficult or impossible to characterize.
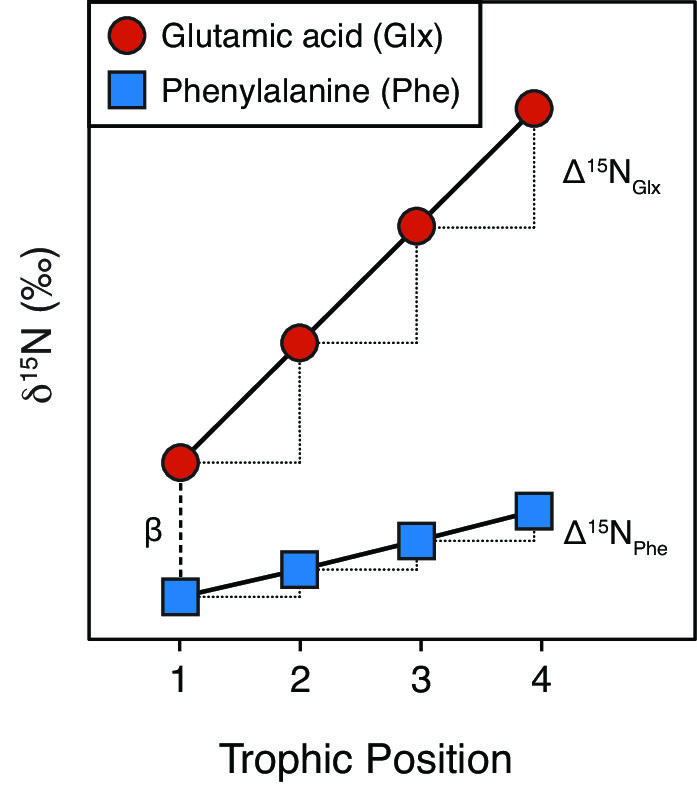
CSIA-AA is useful in trophic ecology studies because AAs are assimilated into consumer tissues in two different ways. The δ15N values of ‘trophic’ AAs, such as glutamic acid (Glx) and proline (Pro), increase substantially (often >4 ‰) as they are transferred from prey to consumer. In contrast, the δ15N values of ‘source’ AAs, such as phenylalanine (Phe) and lysine (Lys), typically change little (often <1 ‰) with trophic transfer. As a result, we can use the δ15N values of ‘trophic’ and ‘source’ AAs extracted from a single consumer tissue sample to estimate a trophic position that is internally indexed to the baseline nutrient source in the consumer’s food web. In theory, this negates the need to independently measure primary producer δ15N values. However, as our article illustrates, the story is not quite that simple!
Underappreciated Variability in Primary Producer Amino Acid Stable Isotope Values
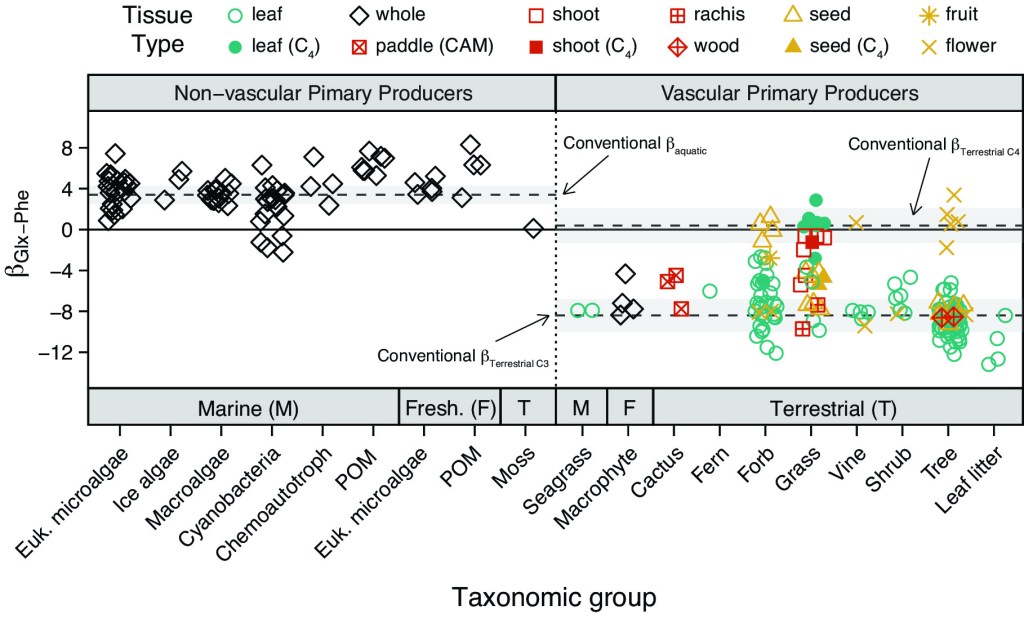
Initial work suggested that beta (β) values—the difference in trophic and source AA δ15N values in primary producers—are well constrained within terrestrial and aquatic systems. This led to the widespread adoption of three constants (± some error) for systems supported by C3 plants, C4 plants, or algae. However, recent studies suggest that β values are more variable than originally considered. In fact, the origin of this meta-analysis can be traced to the authors’ own discovery of this when lead author Dr. Matthew Ramirez generated an early version of Figure 3 (below) for a completely different study! We thus decided to take a deeper dive into this topic using a meta-analysis and simulation of β values in the CSIA-AA literature.
Our work led to four key findings:
- No matter how you slice and dice the data, β values are about twice as variable as typically applied in CSIA-AA-based studies of trophic interactions. Our results indicate that practitioners of CSIA-AA should account for this higher variability in trophic position estimations.
- Whether or not primary producers have vascular systems is more important to explaining β value variation than habitat type (terrestrial vs. aquatic), taxonomy, tissue type (e.g., leaf, seed, stem), or mode of photosynthesis (C3 vs. C4 vs. CAM). Tissue type and lignin content are the largest drivers of variability within vascular plants. Still, much more work is needed to understand how these and other factors (e.g., N assimilation pathway, phenology) influence β values and trophic position estimation. To date, only ~130 genera of primary producers have been sampled for AA δ15N values!
- In vascular plants, we showed that β values calculated using the source AA Lys (instead of the more commonly used Phe) are much less variable and may yield more precise trophic position estimates in certain taxa (e.g., seagrass) or ecosystems (e.g., terrestrial).
- Many biogeochemical mechanisms likely underpin β value variation. But most of it is likely linked to variability in the δ15N values of source AAs due to their catabolism for the synthesis of secondary metabolites and structural compounds (e.g., lignin).
Simulating the Effect of β value variability Using Real-World Datasets
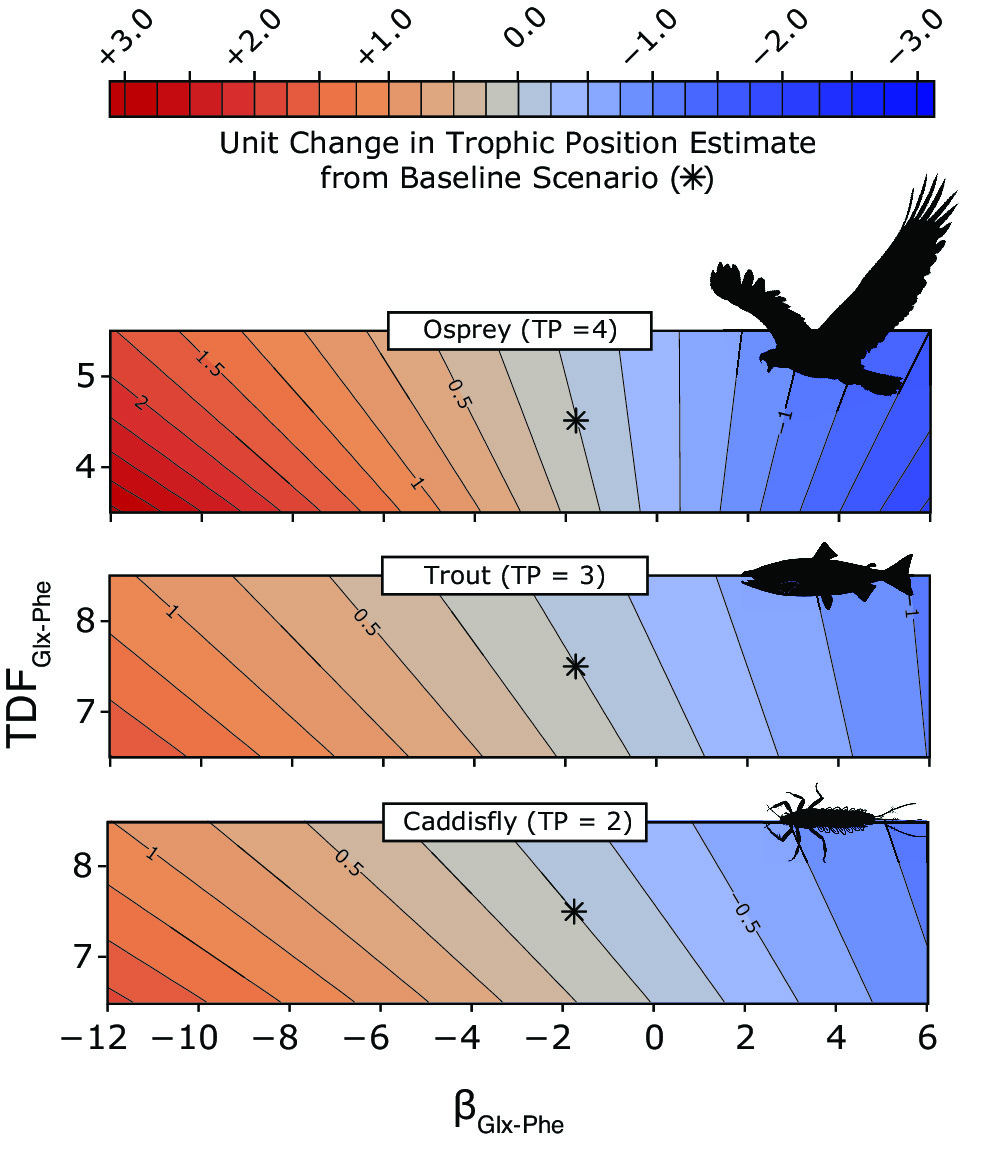
So, how could this variability in β impact trophic position estimates? To address this question, we turned to simulations using real CSIA-AA data for consumers in terrestrial, freshwater (image to the right), and oceanic marine ecosystems. We specifically investigated how assumptions of mean values for parameters generally treated as constants in the trophic position equation—β and trophic discrimination factor (TDFTrophic-Source) for specific trophic-source AA pairs—contribute to variation in mean trophic position values. Long story short, we estimated trophic positions using all combinations of βGlx-Phe and TDF Glx-Phe values within ecologically realistic ranges for each system and consumer and found that variability in β is quite important.
We found that assumptions of mean β Glx-Phe and TDF Glx-Phe values can have complex effects on trophic position estimates that can vary as a function of consumer and ecosystem type. Generally speaking, the influence of β Glx-Phe values relative to TDF Glx-Phe dissipates up the food web —not surprising mathematically, given the position of these parameters in the equation used to quantify trophic position. But there are circumstances where β values punch above their weight to influence trophic position estimates, particularly in aquatic ecosystems fueled by both vascular (e.g., terrestrial plants) and non-vascular (e.g., algae) primary producers (see osprey example). Additionally, trophic position estimates become more sensitive to both parameters the higher a consumer is in the food web.
The Path Forward
In our paper, we outline four key recommendations for identifying, constraining, and accounting for β values variability. There are multiple paths each researcher may take to best suite their focal taxa or system.
- Whenever feasible, sample primary producers in focal food webs.
- In food webs supported by either vascular or non-vascular primary producers, use the most up to date β values and variance estimates from the literature.
- In food webs supported by both vascular and non-vascular primary producers, estimate βmix for each consumer.
- In food webs supported by only vascular primary producers, consider using Lys instead of Phe in trophic position calculations.
Moving forward, we strongly advocate that β values receive greater scrutiny within CSIA-AA studies to improve characterization of consumer trophic status. Additionally, we must expand libraries of primary producer AA δ15N values through more routine sampling to better characterize and understand mechanistic drivers of β value variation.
To read the full study, see the Methods in Ecology and Evolution article: ‘Meta-analysis of primary producer amino acid δ15N values and their influence on trophic position estimation’
To read all articles from the October 2021 Methods in Ecology & Evolution issue, visit the journal website here.
For more Cover Image stories, check out the methodsblog.com blog category here
