Post provided by Michael Heath, Tom Doherty, Jack Laverick & Douglas Speirs

World Fisheries Day, celebrated on November 21, is dedicated to highlighting the critical importance of healthy ocean ecosystems and to ensure sustainable stocks of fisheries in the world. Pressure to find ecologically sustainable strategies for harvesting food from the sea is getting ever stronger, especially in the face of changing climate. However, the question is complex because the harvestable species live in a complex food web where everything is directly or indirectly connected to everything else. Models for carrying out scenario analyses on the impact of fisheries management options on food webs are usually the preserve of trained experts.
In this blog post, Michael Heath of the University of Strathclyde guides us through how using a new marine modelling package and online app, published in their recent Methods in Ecology and Evolution paper ‘StrathE2E2: An R package for modelling the dynamics of marine food webs and fisheries.’, makes these analyses easily accessible to anyone with just basic website skills.
Fish in a food web
In the sea, the food web is tightly linked to ocean physics. Currents and mixing determine how dissolved nutrients such as nitrate, phosphate and silicate are available to micro-algae – phytoplankton, the primary producers of the sea. Many forms of zooplankton, fish, and seabed animals channel the primary production through a network of prey and predator linkages to the charismatic high trophic levels – whales, seals, and birds. A microbial food web recycles detritus back to dissolved nutrient to close the loop between production and consumption.
The effects of fishing and other pressures on any part of the food web are eventually felt everywhere to some extent through the phenomenon known as a ‘trophic cascade’. Cascading effects are attenuated or amplified as they propagate through the food web, depending on the nature of the pressure and details of the ecology. This means that the effects of harvesting, for example herring which is a planktivorous fish species, can extend to both higher and lower trophic levels. However these effects can be difficult to predict without a model that represents all the linkages.
Fishing and fisheries management
The internationally accepted objective of fisheries management has, for many years, been to harvest each exploitable species at its Maximum Sustainable Yield (MSY). The fishing rate required to generate MSY is called FMSY – this is a key reference point for fisheries management. Stock assessments measure the state of each fish stock by the ratio F/FMSY – the current fishing rate on that species relative to its value of FMSY.

But, FMSY is a measure of the productivity of a species, which depends on environmental conditions and the abundances of its predators and prey. So, in reality FMSY values must be inter-dependent between species and likely to change with climate.
As we move from a species-by-species fisheries management regime to one where the objectives include the processes and integrity of the ecosystem as a whole we need whole-system models which include fishing.
Fishing itself is a complex process, involving a plethora of different types of fishing gears. Few gears are sufficiently selective to capture only the desired species. Most catch a range of unintended by-catch, which in some cases can include seabirds, whales and seals. Gears also differ in their physical impact on the seabed. This variety of fishing methods complicates efforts to identify eco-efficient harvesting strategies.
Fisheries Ecosystem modelling
In our Methods in Ecology and Evolution article, we described a software package that combines a marine food web model with a fishing fleet model.
The model is intended as a ‘big-picture’ representation of the fisheries-ecosystem, for broad scale strategic experiments. To enable rapid simulations, species are condensed into coarse functional groups, and spatial distributions into coarse compartments. The benefit is that the model takes only a few seconds to run on an ordinary laptop with minimal coding skills, unlike many other models which require high performance computing facilities and/or extensive training.
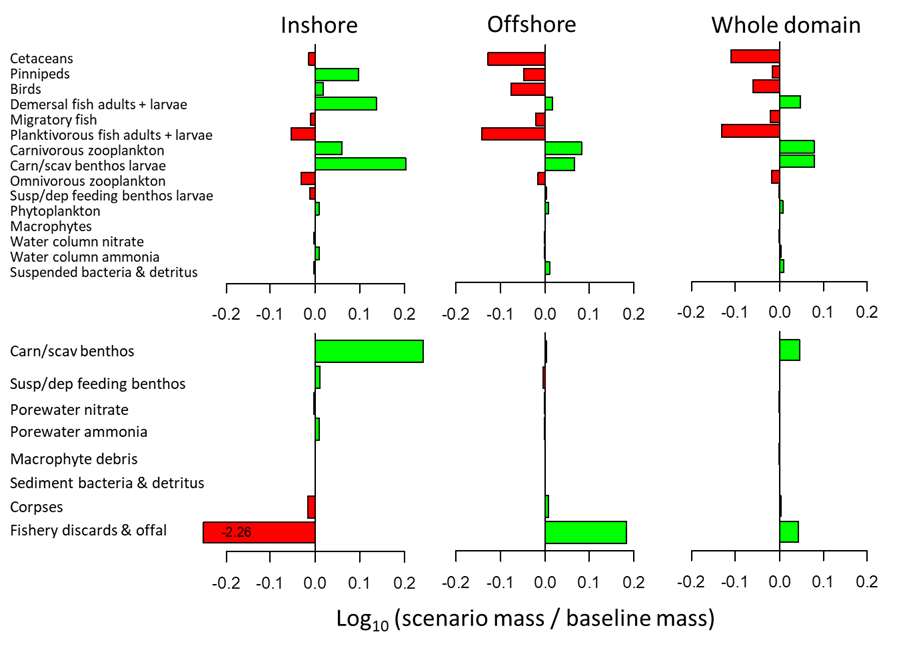
The software package includes a demonstration model for the North Sea. Shown below are results from an experiment simulating the establishment of a static gear reserve in the inshore waters (shallower than 30m, around 25% of the area of the North Sea). The baseline for the experiment is a model for the 1970-1999 environment and fishing situation. In the scenario model, overall activity rates of each fishing gear are the same as in the baseline but towed gears are confined to offshore waters (deeper than 30m). Green bars to the right indicate that annual average mass in the scenario model was greater than the baseline; red bars to the left indicate mass in the scenario case less than baseline. Upper row: water column variables; lower row: seabed variables.
Since publishing our article we have developed models for the Celtic Sea, Barents Sea (study available here) and East Greenland. As part of the EU Horizon 2020 Mission Atlantic project we are implementing the model for waters off Brazil, South Africa, Ascension Island, St Helena, St Peter & St Paul in the South Atlantic, the Azores, Canary Islands, NW Africa and the Norwegian Sea in the North Atlantic. In each case, the model will be used to support Integrated Ecosystem Assessments in collaboration with stakeholders.
To make the model accessible to marine stakeholders we have developed a web-app interface to the software package. The app enables anyone with an internet connection to select a model area, build their own fishing and climate scenario, and compare their model results against a baseline.
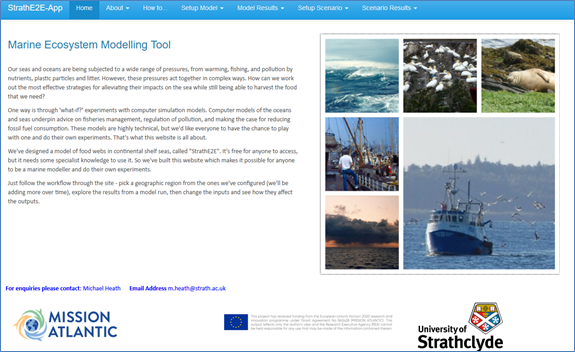
Please visit our app, select one of the available ecosystems and have some fun designing your own fishing scenarios. For us, the ecosystem modelling app is a chance to break out of our world of mathematics and marine science, and enable non-specialists to explore the marine environment though our models.
To access the Marine Ecosystem Modelling Tool, visit the website here.
To read the full Methods in Ecology and Evolution article, ‘StrathE2E2: An r package for modelling the dynamics of marine food webs and fisheries’, visit the paper online here.
