
Post provided by Laura Byrne.
I am a researcher at University College Cork, Ireland, working with statistical models for use with biodiversity data. My research is driven by my interests in sustainability, the facilitation of natural ecosystems alongside necessary urbanisation, statistical modelling, and coding. You can find out more about our work on Diversity-Interactions models (including video introductions, maths and coding tutorials, and an archive of relevant papers) on our website.
Are Diversity-Interactions Models Right for You?
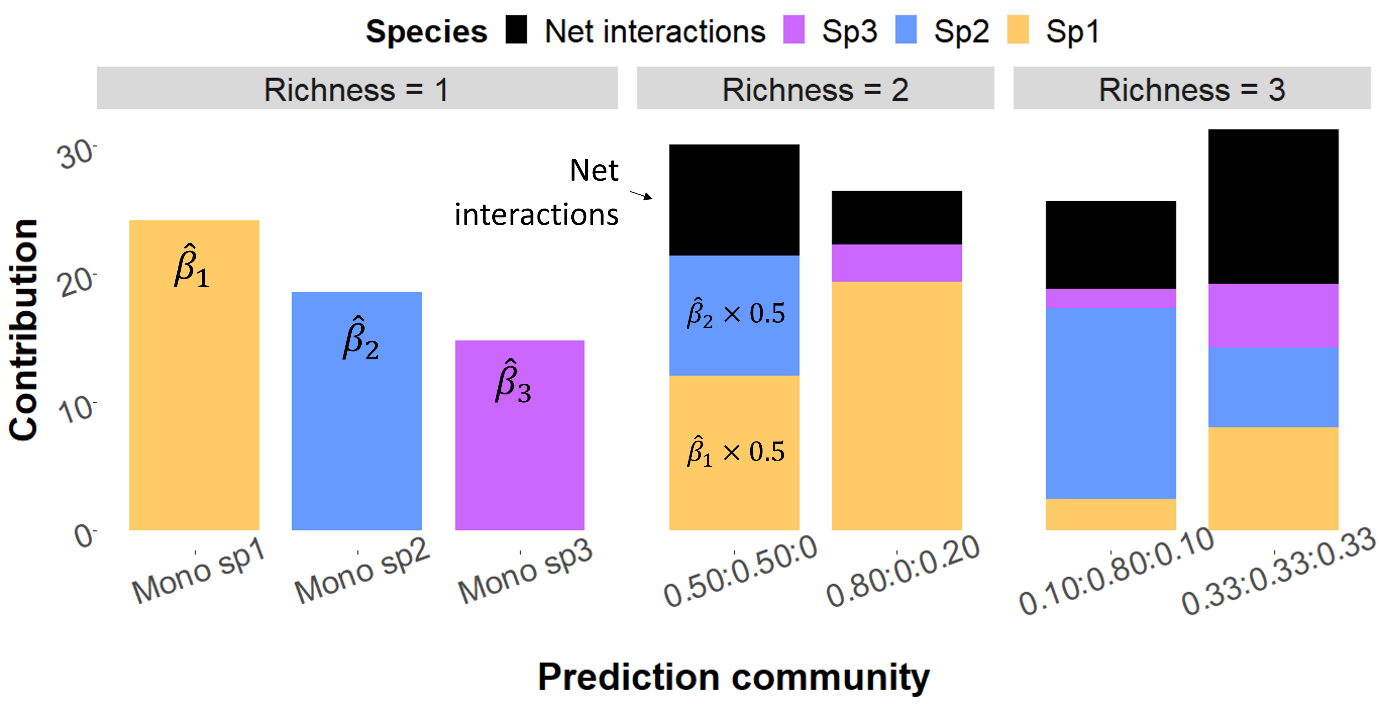
Diversity-Interactions (DI) models, despite sounding complex at first, are actually just your usual run-of-the-mill regression models. What makes them special is their assumption that the main reason behind changes in ecosystem functions (and therefore the main effects in a regression model) are changes in the proportions of the species present, rather than simply how many species there are (richness) or any other single index, e.g. evenness. As these effects will sum to one (proportions), no intercept is estimated for the model and a change in one effect will always result in a change in at least one other effect. This allows us to capture how each species uniquely contributes to the ecosystem and if that contribution is affected by the presence of other species via interactions. These interactions are free to take many forms and the comparison of these different interaction structures often make up the bulk of analyses using DI models. These models can be used as long as you have a dataset with information on the coverage of a study unit, e.g. the proportions of species in a plot of a field, and at least one recording of a response for each unit, e.g. plant biomass. These models were designed for use with plant species but technically have no such restriction in their use, for example, rather than solely plant species in a field, we may include the percentage cover of bare ground as a ‘species’ in the model! Additional information, like soil type, can also easily be included as additional main effects or be used in interactions.
Where This Journey Started: The DImodels R Package
Previously, our research group developed and released the DImodels R package (available here on CRAN) , whose accompanying paper was published in Methods in Ecology and Evolution in 2023. This package made it incredibly easy to fit a range of single-response (univariate) DI models to datasets, including thorough help files and vignettes to make the methodology as accessible as possible, particularly to non-statisticians! The quick uptake of the package by ecologists interested in using DI modelling techniques solidified our decision to endeavour to make tools for this methodology.
Multivariate & Repeated Measures DI Models
While univariate DI models can glean a lot of information about the happenings within an ecosystem, they do only represent a single snapshot in time for a single metric of ecosystem functioning. This is why multivariate and repeated measures DI models were developed, along with an assortment of other advanced models meant to capture the complexities of the biodiversity and ecosystem function (BEF) relationship. Many different BEF studies take place over long periods of time and include the recording of numerous different ecosystem function responses, ripe for use with these DI models that can account for the correlations between readings from the same unit. However, with more complex data and models comes a need for additional coding experience and knowledge of how to interpret the models.
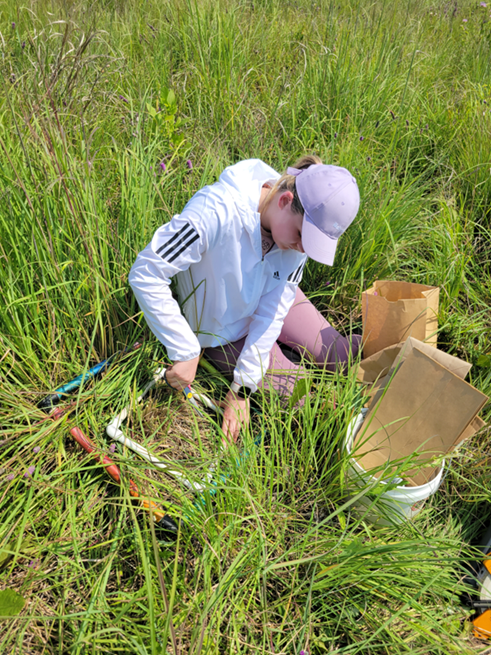
attempting to contribute to the collection of grassland data.
I learned from my short time at the Cedar Creek Ecosystem Science Reserve with the University of Minnesota and at the Biology department in the University of North Dakota just how much blood, sweat, and tears can go into the collection of the data that I find on my desk in a neat excel file. After all of the work that went into collecting this data, why should it be so difficult to use it in an analysis? These experiences, plus those of my colleagues, pushed us to focus on the user-friendly side of tool design when developing the DImodelsMulti R package.
Development & Decisions
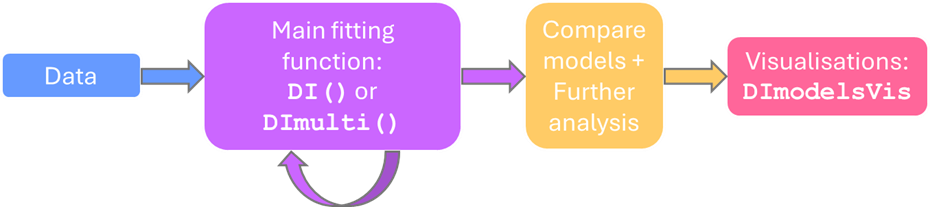
Since the format of the DImodels R package was well received and to prevent confusion when swapping between the packages, DImodelsMulti was designed to follow a very similar workflow, with matching parameter names in the main fitting functions (DI() and DImulti()). It was also ensured that models fit using either package could be used with the DImodelsVis package to produce easy to interpret visualisations. Both packages are filled with help files, vignettes, and, for DImodelsMulti, an R Shiny app to make learning to use these tools as easy as 1, 2, 3.
During development, the question of just how easy we make it to get the fitting function to run stayed with us the whole way through: when we encounter a problem, do we (a) make an assumption of what the user intended to do, fix the problem, print a message to the user stating the problem and how we fixed it, or (b) stop the code from running and display an error message to the user, detailing how they may go about fixing the problem? Our team had people on both ends of this spectrum, knowing that constant error messages for every little problem can be an annoyance when using a function but also that the risk of an inaccurate model being output and interpreted, missing the warning message printed, was a worrisome outcome. We eventually settled on a mix between (a) and (b), depending on the nature of the problem. For relatively simple issues, of low consequence if our assumption for fixing the problem wasn’t accurate, we chose to prioritise getting a model output to the user, while for more egregious issues, we decided it would be best to let the user fix the problem (with the help of clear error messages!).
Wrap it Up
We hope that this tool, its predecessor, and any future additions to the DImodels R package family will make getting the most out of your data a cinch! Perhaps even incentivising other developers to follow in this pursuit of bridging the gap between statisticians and ecologists. Happy analysing.
Read the full paper here.
Post edited by Sthandiwe Nomthandazo Kanyile.
