Post provided by Laura Byrne. I am a researcher at University College Cork, Ireland, working with statistical models for use with biodiversity data. My research is driven by my interests in sustainability, the facilitation of natural ecosystems alongside necessary urbanisation, statistical modelling, and coding. You can find out more about our work on Diversity-Interactions models (including video introductions, maths and coding tutorials, and an archive … Continue reading DImodelsMulti: Making Advanced DI Modelling Accessible.
Post provided by Xiaojie Gao I am a remote sensing ecologist currently working as a postdoctoral researcher at Harvard Forest department of Harvard University. My research focuses on mapping and understanding the impacts of climate change and human activities on the terrestrial vegetation ecosystems. The development of the pnetr R package for forest ecosystem modeling was inspired by my own research interest in understanding how … Continue reading An easy-to-manage tool for forest ecosystem modeling—The pnetr R package
Alessandro Filazzola & Christopher Lortie tell us about their new article ‘A call for clean code to effectively communicate science‘, which provides a series of recommendations and a suite of tools that can be used to help support scientists to produce cleaner code. Can you clearly understand the code that you have written? What about if you gave it to a colleague? Or a reviewer? … Continue reading How to write clean code
If you use genetics to differentiate populations, the new package smartsnp might be your new best friend. Written in R language and available from GitHub and CRAN, this package performs principal component analysis with control for genetic drift, projects ancient samples onto modern genetic space, and tests for population differences in genotypes. The package can load big datasets and run complex stats in the blink of an eye.
Midori Yajima graduated from an MSc in Ecology with a project on palaeoecology and decided to join the online workshop Data Manipulation and Statistical Analysis in Palaeoecology: A Masterclass in R, set up by the Palaeoecology Special Interest Group (PalaeoSIG). In this post, Midori discusses some highlights from the workshop and emphasises the importance of a research community when navigating the programming realm.
Earlier this year, the BES Movement Ecology Special Interest Group held a competition to find the best animal movement maps in four categories: ‘pretty’, ‘nerdy’, ‘dynamic’ and ‘RMap’ (for maps produced entirely using R).
The results of the vote are in, and the winner of the RMap Category is Pratik Gupte from the University of Groningen, who used R to create this beautiful map of elephant movements across thermal landscapes. Here, we asked Pratik for the story behind the elephant map.
In this post, the authors share their inspiration behind the ggtree package for R and present new resources of ggtree and a series of other related packages.
The team publishing the ggtree paper is working in the field of emerging infectious diseases. Particularly the corresponding author Tommy Lam (TL) has been advocating the integration of different biological and epidemiological information in the studies of fast-evolving viral pathogens. The lead author Guangchuang Yu (GY) joined The University of Hong Kong to pursue his doctorate degree under the supervision of TL and Yi Guan (co-author in the paper), as he was very curious about the application of genomics and phylogenetics in the study of emerging infectious diseases.
This post recalls the journey on how we ended up developing cxr (acronym for CoeXistence relationships in R), an R package for quantifying interactions among species and their coexistence relationships. In other words, it provides tools for telling apart the situations in which different species can persist together in a community from the cases in which one species completely overcomes another.
مدلسازی توزیع گونهها به تخمین و برآورد ارتباط بین مجموعهای از نقاط حضور گونه با متغیرهای زیستمحیطی مرتبط می پردازد. یکی از مراحل اساسی این فرایند، ارزیابی قدرت مدل برای پیشبینی مکانهایی است که احتمال حضورگونه در آنجا وجود دارد. این کار اغلب با ارزیابی پیشبینی انجام شده در مجموعهای ازنقاط که در فرآیند مدلسازی مورد استفاده قرار نگرفته اند (نقاط آزمایشی) صورت میگیرد.
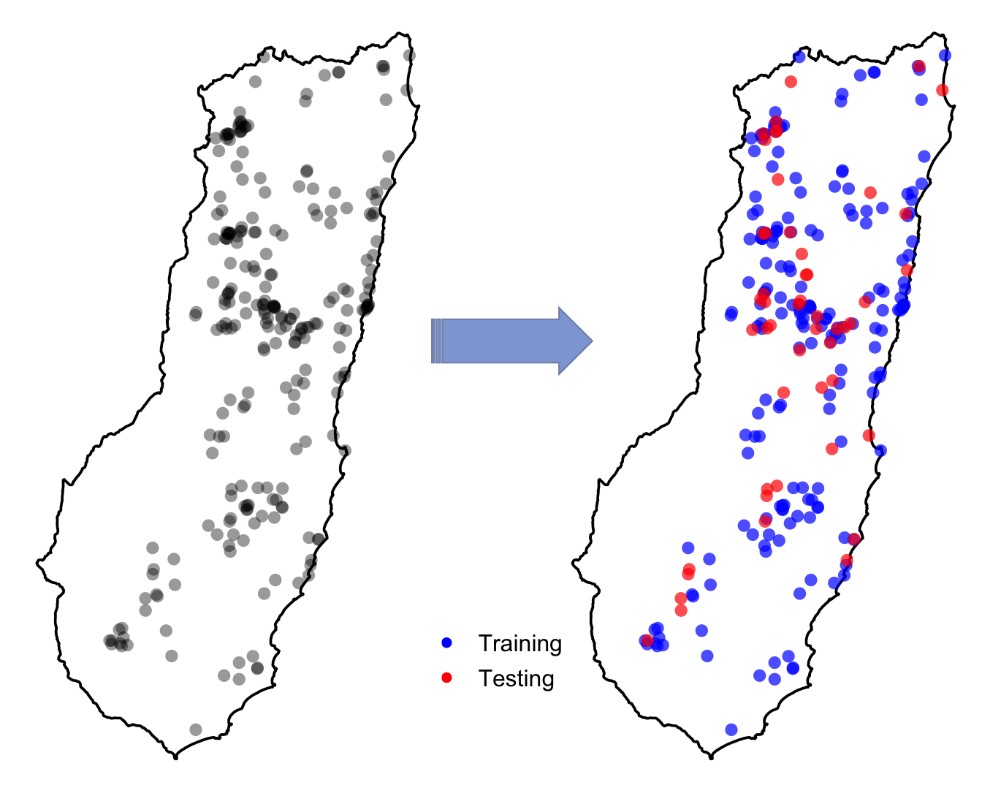
تقسیم تصادفی دادههای حضور گونه به نقاط آزمایشی و آموزشی
مطالعات پیشین بر این نکته تاکید دارند که به منظور ارزیابی معتبر، نقاط آزمایشی باید مستقل از نقاط آموزشی باشند، این درحالیست که داده مستقل واقعی به ندرت در دسترس می باشد. به همین دلیل، در فرایند مدلسازی معمولا دادههای موجود را به دو قسمت دادههای آموزشی (برای کالیبره کردن مدل) و داده های آزمایشی (برای ارزیابی دقت مدل) تقسیم میکنند، این استراتژی میتواند چند قسمتی هم باشد (برای مثال اعتبارسنجی متقاطع یا cross-validation). از آنجاییکه این تقسیم بندی معمولا بصورت تصادفی انجام میشود، بنابراین گاهی اوقات نقاط آزمایشی در فواصل نزدیک به نقاط آموزشی قرار میگیرند. شکل زیر این مساله را به خوبی نشان می دهد که در آن نقاط آزمایشی به رنگ قرمز و نقاط آموزشی آبی هستند. اما آیا این مساله میتواند مشکلی ایجاد کند؟ Continue reading “اعتبارسنجی متقاطع مکانی در مدلسازی توزیع گونهها”