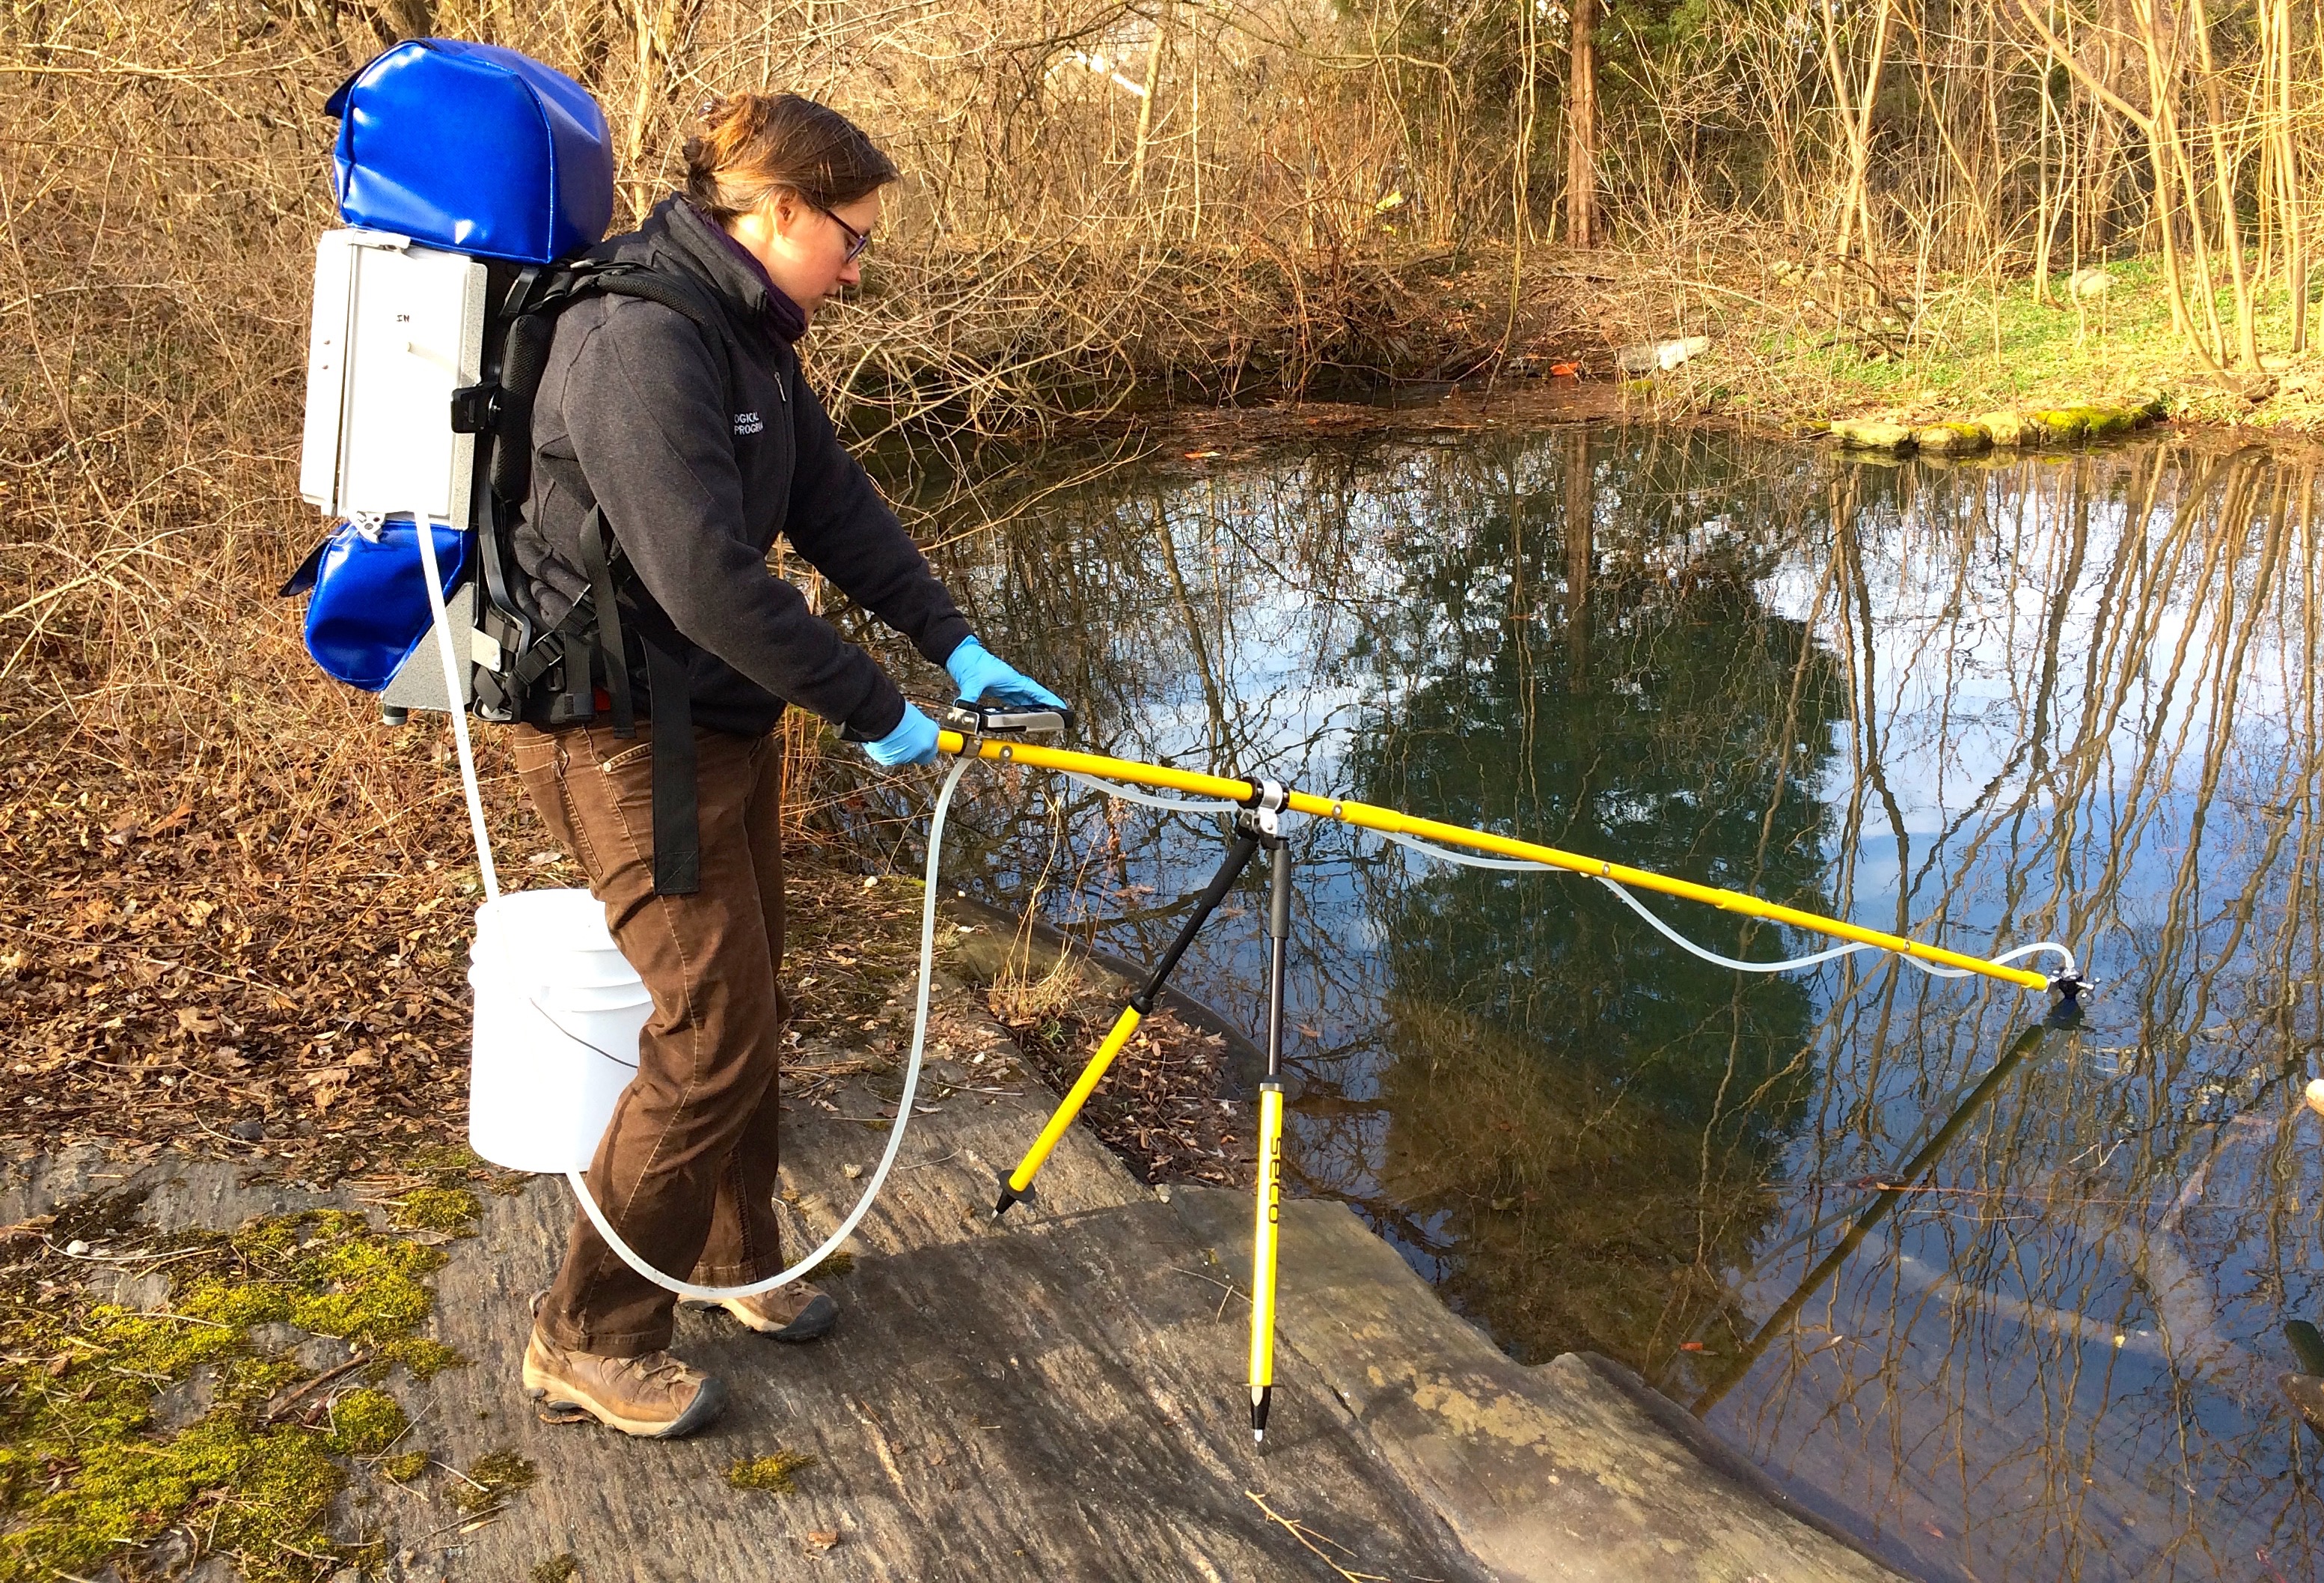
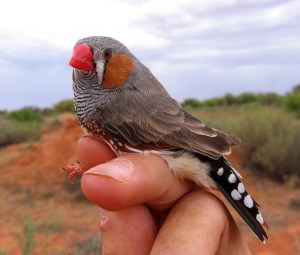
Existe un creciente interés por parte de muchos investigadores por entender cómo el comportamiento social de los animales influencia otros procesos biológicos. Sin embargo, estudiar las interacciones entre múltiples individuos presenta un enorme reto metodológico, ya que el número de potenciales interacciones simultáneas aumenta, casi exponencialmente, con el tamaño del grupo (cada individuo puede interactuar con todos los demás miembros del grupo). Además, la cantidad de datos necesarios para un análisis robusto también se incrementa, haciendo difícil que los registros sean completos y representativos. Continue reading “Un nuevo método para automatizar los estudios de comportamiento en aves”
The Global Pollen Project is an online, freely available tool and data source developed to help people identify and disseminate palynological resources. Palynology – the study of pollen grains and other spores – is used across many fields of study including modern and fossil vegetation dynamics, forensic sciences, pollination, and beekeeping. To help make pollen identification quicker and more transparent, we developed the Global Pollen Project (GPP) – an open, peer-reviewed database of global pollen morphology, where content and expertise is crowdsourced from across the world. Our approach to developing this tool was open: open code, open data, open access. It connects to other data services, including the Global Biodiversity Information Facility and Neotoma Palaeoecology Database, to provide occurrence data for each taxon, alongside pollen images and metadata. Continue reading “The Global Pollen Project: An Update for Methods Readers”
Some individuals survive and reproduce better than others. Traits that help them do so may be passed on to the next generation, leading to evolutionary change. Because of this, evolutionary biologists are interested in what differentiates the winners from the losers – how do their traits differ, and by how much? These differences are known as natural selection.
Linear and Nonlinear Selection
Traditionally, natural selection is separated into linear selection (differences in average trait values) and nonlinear selection (any other differences in trait distributions between winners and the rest). For example, successful individuals might be unusually close to average: this is known as stabilizing selection. Alternatively, winners might split into two camps, some with unusually high trait values, and others with unusually low trait values. This is disruptive selection (famously thought to explain the ur-origin of sperm and eggs). Stabilizing and disruptive selection are important types of nonlinear selection. In general, though, the trait distribution of successful individuals can differ from the general population in arbitrarily complicated ways.
When individuals with larger trait values have higher fitness on average (left panel), the trait distribution of successful individuals is shifted towards the right (right panel, orange curve). The difference in mean trait values between the winners and the general population is called linear selection.
The standard approach to quantifying natural selection, developed by Lande and Arnold, does not allow for comparable metrics between linear (i.e. selection on the mean phenotype) and nonlinear (i.e. selection on all other aspects of the phenotypic distribution, including variance and the number of modes) selection gradients. Jonathan Henshaw’s winning submission provides the first integrated measure of the strength of selection that applies across qualitatively different selection regimes (e.g. directional, stabilizing or disruptive selection). Continue reading “2017 Robert May Prize Winner: Jonathan Henshaw”
I was really happy to hear that our paper, ‘HistMapR: Rapid digitization of historical land‐use maps in R’ was shortlisted for the 2017 Robert May Prize, and to be asked to write a blog to mark the occasion. The paper was already recommended in an earlier blog post by Sarah Goslee (the Associate Editor who took care of our submission), and described by me in an instructional video, so I thought that I would write the story of our first foray into making an R package, and submitting a paper to a journal that I never thought I would ever get published in.
Background: Changing Land-Use and Digitizing Maps
Land-use change in Europe is often typified by land-drainage to create arable fields.
Land-use change is largely accepted to be one of the major threats to biodiversity worldwide at the moment. At the same time, a warming climate means that species’ ranges need to move poleward – something that can be hampered by changing land use. Quantifying how land use has changed in the past can help us to understand how species diversity and distributions respond to environmental change.
Unfortunately, quantifying this change by digitizing historical maps is a pretty tedious business. It involves a lot of clicking around various landscape features in a desktop GIS program. So, in many cases, historical land use is only analyzed in a relatively small number of selected landscapes for each particular study. In our group at Stockholm University, we thought that it would be useful to digitize maps over much larger areas, making it possible to assess change in all types of landscape and assess biodiversity responses to land-use change at macroecological scales. The question was, how could we do this? Continue reading “HistMapR: 12 Months from Coffee Break Musings to a Debut R Package”
Ecologists have long been fascinated by animal sounds and in recent decades there’s been growing interest in the field of ‘bioacoustics’. This has partially been driven by the availability of high-definition digital audio recorders that can withstand harsh field conditions, as well as improvements in software technology that can automate sound analysis.
Each year an uncountable number of airborne organisms, mainly birds and insects, venture out on long journeys across the globe. In particular, the mass movements of birds have fascinated humankind for hundreds of years and inspired a wealth of increasingly sophisticated studies. The development and improvement of individual tracking devices in animal research and has provided amazing insights into such extensive journeys. Study of mass movements of biological organisms is still a challenge on continent-wide or cross-continental scales.
One tool that can effectively track and/or monitor large numbers of birds is radar technology. Radars offer many advantages over other methods such as visual counts or ringing. They’re less expensive, need less effort, offer better visibility and detectability, and are more applicable for large-scale monitoring. Networks of meteorological radars (as opposed to individual radars) seem particularly promising for large-scale studies. Continue reading “Radar Wind Profilers: A Widespread but Unused Remote Sensing Tool for Migration Ornithologists”
Quantitative syntheses of primary research studies (meta-analysis) are being used more and more in ecological and evolutionary research. So knowing the basics of how meta-analysis works is important for every researcher. Meta-analytical thinking also encourages us scientists to see each single primary research study as a substantial contribution to a larger picture.
To be included in a meta-analysis, relevant primary research studies must be easy to find and basic information about the methods and results must be thoroughly, clearly and transparently reported. Moreover, papers with accessible data are the most useful for meta-analyses. Many published papers provide this information, but it’s not unusual for essential data to be omitted. Studies that are missing these details can’t be used in meta-analyses, which limits their reach. Continue reading “Meta-Analysis: How to Increase the Reach of Your Research and Make it Longer Lasting”
Expert judgement is used to predict current and future trends for Koala populations across Australia
New technologies provide ecologists with unprecedented means for informing predictions and decisions under uncertainty. From drones and apps that capture data faster and cheaper than ever before, to new methods for modelling, mapping and sharing data.
But what do you do when you don’t have data (or the data you have is incomplete or uninformative), but decisions need to be made?
In real-life situations, it is far more common for decisions to be based on a comparison between things that can’t be judged on the same standards. Whether you’re choosing a dish or a house or an area to prioritise for conservation you need to weigh up completely different things like cost, size, feasibility, acceptability, and desirability.
Those three examples of decisions differ in terms of complexity – you’d need specific expert knowledge and/or the involvement of other key stakeholders to choose conservation prioritisation areas, but probably not to pick a dish. The bottom line is they all require evaluating different alternatives to achieve the desired goal. This is the essence of multi-criteria decision analysis (MCDA). In MCDA the pros and cons of different alternatives are assessed against a number of diverse, yet clearly defined, criteria. Interestingly, the criteria can be expressed in different units, including monetary, biophysical, or simply qualitative terms. Continue reading “Applications of Multi-Criteria Decision Analysis in Conservation Research”