New Technologies Could Help Conservationists Keep Better Track of Serengeti Wildebeest Herds

Below is a press release about the Methods in Ecology and Evolution article ‘A comparison of deep learning and citizen science techniques for counting wildlife in aerial survey images‘ taken from the University of Glasgow.

A wildebeest herd in the Serengeti. ©Daniel Rosengren

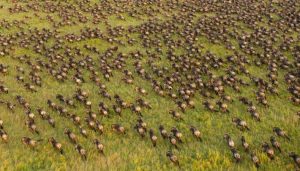
Mathematicians and conservationists from the UK, Africa and the United States have used machine-learning and citizen science techniques to accurately count wildebeest in the Serengeti National Park in Tanzania more rapidly than is possible using traditional methods.

Evaluating wildebeest abundance is currently extremely costly and time-intensive, requiring manual counts of animals in thousands of aerial photographs of their habitats. From those counts, which can take months to complete, wildlife researchers use statistical estimates to determine the size of the population. Detecting changes in the population helps wildlife managers make more informed decisions about how best to keep herds healthy and sustainable. Continue reading “New Technologies Could Help Conservationists Keep Better Track of Serengeti Wildebeest Herds”

Advances in Modelling Demographic Processes: A New Cross-Journal Special Feature

Analysis of datasets collected on marked individuals has spurred the development of statistical methodology to account for imperfect detection. This has relevance beyond the dynamics of marked populations. A couple of great examples of this are determining site occupancy or disease infection state.

EURING Meetings

The regular series of EURING-sponsored meetings (which began in 1986) have been key to this development. They’ve brought together biological practitioners, applied modellers and theoretical statisticians to encourage an exchange of ideas, data and methods.

This new cross-journal Special Feature between Methods in Ecology and Evolution and Ecology and Evolution, edited by Rob Robinson and Beth Gardner, brings together a collection of papers from the most recent EURING meeting. That meeting was held in Barcelona, Spain, 2017, and was hosted by the Museu de Ciènces Naturals de Barcelona. Although birds have provided a convenient focus, the methods are applicable to a wide range of taxa, from plants to large mammals. Continue reading “Advances in Modelling Demographic Processes: A New Cross-Journal Special Feature”

New Associate Editor: Res Altwegg

Today, we are pleased to be welcoming a new member of the Methods in Ecology and Evolution Associate Editor Board. Res Altwegg joins us from the University of Cape Town, South Africa and you can find out a little more about him below. Res Altwegg “My interests lie at the intersection between ecology and statistics, particularly in demography, population ecology, species range dynamics and community ecology. My work … Continue reading New Associate Editor: Res Altwegg

How Many Animals are Infected with Chronic Wasting Disease?

Post provided by Hildegunn Viljugrein

©Alexandre Buisse
©Alexandre Buisse

The discovery of Chronic Wasting Disease (CWD) in Norway in 2016 has led to extensive measures and testing of deer in Norway. Since 2018 there have been similar measures within the EU. But how many deer need to be tested before we can be (almost) certain that a population is not infected by CWD?

In our article – ‘A method that accounts for differential detectability in mixed samples of long‐term infections with applications to the case of Chronic Wasting Disease in cervids’ – we provide important tools for estimation of prevalence and likelihood of finding infected animals in a given population. The paper is a result of a collaborative work between a multidisciplinary group of scientists from the Norwegian Veterinary Institute, Norwegian Institute for Nature Research and Prof. Atle Mysterud from Centre for Ecological and Evolutionary Synthesis at the University of Oslo. Continue reading “How Many Animals are Infected with Chronic Wasting Disease?”

Spatial Capture-Recapture: The Pros and Cons of Aggregating Detections

Post provided by Cyril Milleret

Spatial Capture-Recapture and Computation Time

SCR models simultaneously estimate the detection function and density of individual activity centres. A half-normal detection model is generally used.

The estimation of population size is one of the primary goals and challenges in wildlife ecology. Within the last decade and a half, a new class of tools has emerged, allowing us to estimate abundance and other key population parameters in specific areas. So-called spatial capture-recapture (SCR) models are growing in popularity not only because they can map abundance, but also because they can be fitted to data collected from a variety of monitoring methods. For example, the ever increasing use of non-invasive monitoring methods, such as camera trapping and non-invasive genetic-sampling, is one of the reason that makes SCR models so popular.

One other strengths of SCR models is the ability to make population level inferences. But the wider the region you’re monitoring, the greater the computational burden, challenging the use of such methods at really large scale. Continue reading “Spatial Capture-Recapture: The Pros and Cons of Aggregating Detections”

Remote Sensing for Counting Animals: Polar Bears, Sheep and Everything In-Between

Post provided by Tracey Hollings

In an age of rapid technological advances, ecologists need to keep abreast of how we can improve or reinvent the way we do things. Remote sensing technology and image analysis have been developing rapidly and have the potential to revolutionise how we count and estimate animal populations.

Using remotely sensed imagery isn’t new in ecology, but recent innovations mean we can use it for more things. Land use change and vegetation mapping are among the areas of ecology where remote sensing has been used extensively for some time. Estimating animal populations with remotely sensed imagery was also demonstrated more than 40 years ago by detecting indirect signs of an animal with some success: think wombat burrows and penguin poop.

A polar bear from a helicopter

Thanks to improved spatial and spectral resolution (see the text box at the bottom of the post for a definition), accessibility, cost and coverage of remotely sensed data, and software development we have now reached a point where we can detect and count individual animals in imagery. Many of the first studies to demonstrate automated and semi-automated techniques have taken computer algorithms from other disciplines, such as engineering or biomedical sciences, and applied them to automate counting of animals in remotely sensed imagery. It turns out that detecting submarines is not so different to detecting whales! And finding abnormal cells in medical imaging is surprisingly similar to locating polar bears in the arctic! Continue reading “Remote Sensing for Counting Animals: Polar Bears, Sheep and Everything In-Between”

New Associate Editor: Chris Sutherland

Today, we are pleased to welcome the latest new member of the Methods in Ecology and Evolution Associate Editor Board. Chris Sutherland joins us from the University of Massachusetts, USA and you can find out a little more about him below. Chris Sutherland “I’m an applied ecologist with a focus on spatial population ecology. I am particularly interested in understanding how spatial processes such as movement, … Continue reading New Associate Editor: Chris Sutherland

How Can We Quantify the Strength of Migratory Connectivity?

Technological advancements in the past 20 years or so have spurred rapid growth in the study of migratory connectivity (the linkage of individuals and populations between seasons of the annual cycle). A new article in Methods in Ecology and Evolution provides methods to help make quantitative comparisons of migratory connectivity across studies, data types, and taxa to better understand the causes and consequences of the seasonal distributions … Continue reading How Can We Quantify the Strength of Migratory Connectivity?

Sticking Together or Drifting Apart? Quantifying the Strength of Migratory Connectivity

Post provided by Emily Cohen

Red Knot migratory connectivity is studied with tracking technologies and color band resighting. © Tim Romano
Red Knot migratory connectivity is studied with tracking technologies and colour band resighting. © Tim Romano

The seasonal long-distance migration of all kinds of animals – from whales to dragonflies to amphibians to birds – is as astonishing a feat as it is mysterious and this is an especially exciting time to study migratory animals. In the past 20 years, rapidly advancing technologies  – from tracking devices, to stable isotopes in tissues, to genomics and analytical techniques for the analysis of ring re-encounter databases – mean that it’s now possible to follow many animals throughout the year and solve many of the mysteries of migration.

What is Migratory Connectivity?

One of the many important things we’re now able to measure is migratory connectivity, the connections of migratory individuals and populations between seasons. There are really two components of migratory connectivity:

  1. Linking the geography of where individuals and populations occur between seasons.
  2. The extent, or strength, of co-occurrence of individuals and populations between seasons.

Continue reading “Sticking Together or Drifting Apart? Quantifying the Strength of Migratory Connectivity”

Issue 8.11

Issue 8.11 is now online!

The November issue of Methods is now online!

This extra large issue contains seven Applications articles and three Open Access articles. These five papers are freely available to everyone, no subscription required.

 LSCorridors: LandScape Corridors considers stochastic variation, species perception and landscape influence on organisms in the design of ecological corridors. It lets you simulate corridors for species with different requirements and considers that species perceive the surrounding landscape in different ways.

 HistMapR: HistMapR contains a number of functions that can be used to semi-automatically digitize historical land use according to a map’s colours. Digitization is fast, and agreement with manually digitized maps of around 80–90% meets common targets for image classification. This manuscript has a companion video and was recommended by Associate Editor Sarah Goslee.

 vortexR: An R package to automate the analysis and visualisation of outputs from the population viability modelling software Vortex. vortexR facilitates collating Vortex output files, data visualisation and basic analyses (e.g. pairwise comparisons of scenarios), as well as providing more advanced statistics.

Continue reading “Issue 8.11”