Post provided by Alistair Auffret
I was really happy to hear that our paper, ‘HistMapR: Rapid digitization of historical land‐use maps in R’ was shortlisted for the 2017 Robert May Prize, and to be asked to write a blog to mark the occasion. The paper was already recommended in an earlier blog post by Sarah Goslee (the Associate Editor who took care of our submission), and described by me in an instructional video, so I thought that I would write the story of our first foray into making an R package, and submitting a paper to a journal that I never thought I would ever get published in.
Background: Changing Land-Use and Digitizing Maps

Land-use change is largely accepted to be one of the major threats to biodiversity worldwide at the moment. At the same time, a warming climate means that species’ ranges need to move poleward – something that can be hampered by changing land use. Quantifying how land use has changed in the past can help us to understand how species diversity and distributions respond to environmental change.
Unfortunately, quantifying this change by digitizing historical maps is a pretty tedious business. It involves a lot of clicking around various landscape features in a desktop GIS program. So, in many cases, historical land use is only analyzed in a relatively small number of selected landscapes for each particular study. In our group at Stockholm University, we thought that it would be useful to digitize maps over much larger areas, making it possible to assess change in all types of landscape and assess biodiversity responses to land-use change at macroecological scales. The question was, how could we do this?
Spring: Categorizing Maps with Not-So-Magic Wands
During a coffee break in Stockholm in early 2016 the subject came up, and we wondered about the potential of using the “magic wand” tool available in various imaging editing software packages. This tool would allow you to select areas of similar colour representing different land-use categories, but the lack of GIS support within these programs would have been a serious drawback. Then it struck us that the magic wand tool isn’t actually magic at all! Its colour selection is only based on each pixel’s RGB (red, green, blue) values, a combination of three numbers from 0-255. If it’s just numbers, then surely we could do it in R?

And so a project was born. A few weeks later, I presented some code at the group’s annual getaway, where I had simply defined colours by inputting appropriate RGB values for each category to digitize a couple of sheets of the Swedish economic map (i.e. high values of red and green, and low values of blue to capture the yellow arable land). I also showed that you could classify several maps ‘automatically’ using the same values, significantly speeding up the digitization process. As most of us had spent some time digitizing maps manually, we were all quite excited by this. We thought that it would be a good opportunity to work together as a group and map a large area of Sweden.
Summer: From Code to R Functions
The next step was that Adam and I turned the code into R-functions. We added functionality for smoothing out the colours in the maps, removing areas of black text and administrative boundaries, and added the ability to click different areas of the map to define the RGB values for each land-use category (thanks to the click function from the excellent raster package, which HistMapR relies upon).
Autumn: Digitizing mid-20th Century Sweden
When we were happy that the method worked, it was time digitize mid-20th century Sweden.
There were eight of us in total, and we split the 7069 maps between us. At the same time, I tried out the method on two other series of historical maps to make sure that the method wasn’t just a one hit wonder. Our R skills ranged from confident users to absolute beginners, which really helped us to identify and solve all the problems that we met along the way. We improved the code to avoid issues when we could, and tried to make the error messages useful when we couldn’t. It was an autumn of staring at different shades of yellow and green, and although we were very pleased with the rate that we were getting things done, it was admittedly still quite tedious business.
Winter: Presenting Our Work to Wider Audience
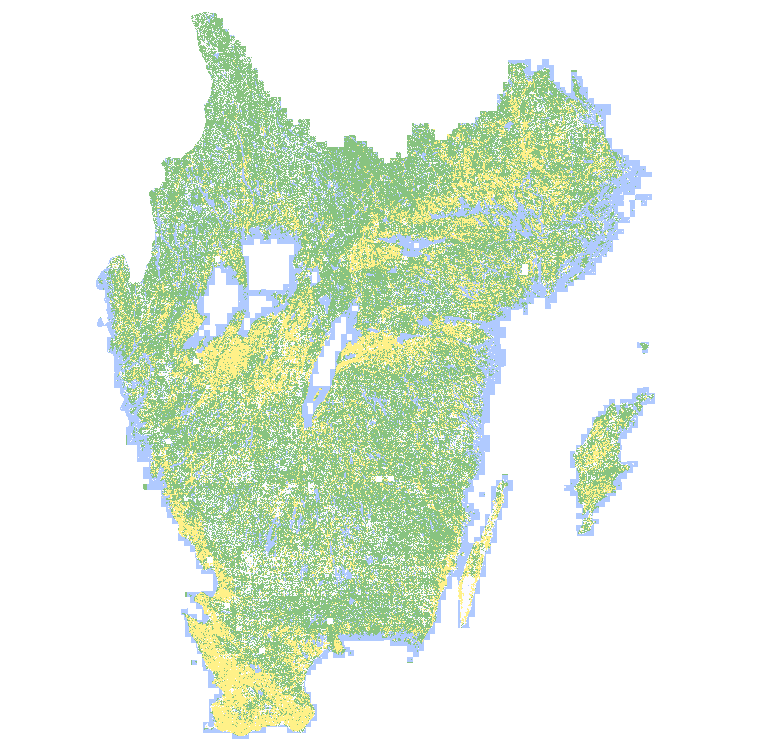
Once everyone had finished their mapping and we had created a very pleasing picture of southern Sweden 60 or so years ago, the next important step was to verify whether or not our R-digitizations were actually any good. We did this by comparing them to the manually-digitized maps that we and other colleagues had created over the years for our various projects. We were relieved to see that our results were good, matching accuracy targets used in remote sensing and having low rates of error when considering the make-up of the landscape as a whole.
The British Ecological Society Annual Meeting in December 2016 in Liverpool played an important part in the story. I presented a poster describing the method, which gained quite a bit of attention (even though it felt like I was placed was in the darkest corner of the ACC). This convinced me that our method would be useful to a wider audience, and that we should try to publish it in Methods in Ecology and Evolution.
After the conference, a colleague at the University of York, where I was working as a visiting researcher, who had attended the pre-conference coding workshop gave a short talk back at the department telling us the advantages of using github. This inspired me to turn our functions into a package (thanks, devtools), with help files, built-in examples, and a name with a capital R in it. Once the package was finished and named, we were ready to send it to Methods. The review process was extremely smooth and fast, and just over a year after our fateful coffee break our paper was published online.
Post publication: Maps and Method Proving Useful

We knew that historical maps over large scales would be of interest to others, particularly governmental and non-governmental organizations and conservation practitioners. This is why we chose to make them freely available to everyone. So far, the maps are being used by others to identify areas for wetland restoration on abandoned arable fields on peat soils, grassland restoration in abandoned pastures, a nationwide project with the aim of improving green infrastructure, and looking for (and finding!) rare mushrooms in old-growth forest.
The method itself also seems to be being used. As well as the different Swedish and UK maps that we tested on during method development, HistMapR has also been used or is being used to digitize historical maps in Finland, the US, Spain and Canada. I hope that there are others, and I would love to hear about our method being used to digitize historical maps from different regions and time periods, and for those maps to be used to answer important ecological questions.
To find out more about HistMapR, read our Methods in Ecology and Evolution article ‘HistMapR: Rapid digitization of historical land‐use maps in R’ (No Subscription Required).
This article was shortlisted for the 2017 Robert May Early Career Researcher Prize. Check back here each day this week to find out about more shortlisted articles and find out the winner on Monday 16 April.
