Post provided by Guangchuang Yu and Tommy Tsan-Yuk Lam
To celebrate the 10th Anniversary of the launch of Methods in Ecology and Evolution, we are highlighting an article from each volume to feature in the Methods.blog. For Volume 8, we have selected ‘ggtree: an r package for visualization and annotation of phylogenetic trees with their covariates and other associated data‘ by Yu et al. (2016).
In this post, the authors share their inspiration behind the ggtree package for R and present new resources of ggtree and a series of other related packages.
The team publishing the ggtree paper is working in the field of emerging infectious diseases. Particularly the corresponding author Tommy Lam (TL) has been advocating the integration of different biological and epidemiological information in the studies of fast-evolving viral pathogens. The lead author Guangchuang Yu (GY) joined The University of Hong Kong to pursue his doctorate degree under the supervision of TL and Yi Guan (co-author in the paper), as he was very curious about the application of genomics and phylogenetics in the study of emerging infectious diseases.

At one time, while TL was guiding another student in a project of swine influenza evolution, GY was asked to provide assistance to modify the newick tree string to incorporate some additional information (such as amino acid substitutions and number of glycosylation sites) in the internal node labels of the phylogeny for visualization and comparative analysis. He wrote an R script to do that, but he soon realized that most phylogenetic tree viewing software could only display one type of node label at a time. Therefore, to produce tree graphs displaying different types of branch/node associated information side-by-side, such as bootstrap values and substitutions, people mostly relied on post-processing image software. Such manual edits often take hours and need to be redone whenever the tree was updated with new sequences or other data. At the time, GY tried to find a programming library that could flexibly display different variables directly on the tree figure for visualization and publication-ready graphics. However, none could achieve that in a robust and efficient way and generalizable to different data. This was the motivation behind the development of the ggtree package in R.
There are several ggplot2 extensions that are able to draw tree diagrams, including ggphylo, phyloseq, and OutbreakTools. However, the most valuable part of the ggplot2 syntax – adding layers of annotations – is not supported in these packages. GY thought really hard on the design of a user interface that would fully embrace the grammar of ggplot2 graphic syntax. He first extended the ggplot() function to support phylogenetic tree objects and added the geom_tree() layer to calculate the position of line segments for drawing a tree. Then a set of geometric layers were developed to allow adding annotation layers on the tree. Another important issue that needed to be addressed was how to link external data to the tree structure in an efficient way. For this, GY designed the new ‘%<+%’ operator for attaching external data, as well as all the variables stored in the data, such that they are visible to the geom_tree() function and can be used directly to annotate the tree. The ‘%<+%’ operator allows users to integrate external datasets and display them on different annotation layers. TL also proposed to implement parser functions in ggtree to import tree data and other evolutionary inference results from different external software packages such as BEAST, Hyphy, PAML, among others, so that different analysis results can be displayed and analyzed on the tree collectively in R. Despite the long time that it took to implement these and other important functionalities into ggtree, GY deeply enjoyed the process and learned much from it. The effort was soon rewarded with the publication of the ggtree paper in Methods in Ecology and Evolution, now among the most cited publications in the journal.

The ggtree package remains actively maintained and extended after the MEE paper was published. As more functions were implemented, the maintenance tends to become more difficult. Therefore, GY started to split the ggtree package into multiple packages, including tidytree for manipulating tree with data using the tidy interface; treeio for importing and exporting tree with richly annotated data (recently published here); ggimage for overlaying silhouette images. This way the ggtree package can focus on tree visualization and annotation. The ggtree package supports the use of the gheatmap() function to plot a tree with a heatmap. There are also other tools that support visualizing a tree with a barplot or dotplot. However, there is no general tool for aligning a tree with a graph, such as a histogram of the species data. The two graphs could not simply be put side-by-side, since the data used to produce the graph should be re-ordered to match the taxa order of the phylogenetic tree. Only in this way, the data visualized in the graph can be interpreted in an evolutionary context.

Functions for aligning a phylogeny with different graphs for varied purposes have been continuously developed, but no one have proposed a general solution with a high-level abstraction. The central question is: what is the objective to be achieved when one incorporates data to a phylogenetic tree? Eventually, GY figured out that most of what we are trying to do can be divided into two categories: one for mapping data to the tree structure, to either display the data directly or use the data as information to create a tree visualization, and another category for presenting data and a phylogeny side-by-side, employing the tree structure to help to interpret the graph in an evolutionary context. For the first category of visualization, one can use ggtree’s ‘%<+%’ operator introduced on an earlier version of the package. In the case of side-by-side visualization, the geom_facet() layer was developed as a general solution. It automatically re-orders the input data according to the tree structure and allow for plotting it at a different panel following a user-provided geometric layer. These two methods were published a 2018 Molecular Biology and Evolution paper. The limitation for the geom_facet() layer is that it currently only supports a rectangular layout. To support presenting data in outer rings for a circular layout, the ggtreeExtra package was developed. The output of ggtree is a serialized data object that maintains the input tree, the associated data, and the visualization directive, making it an ideal data structure for publishing phylogenetic trees with almost all the information incorporated (see more about this here).
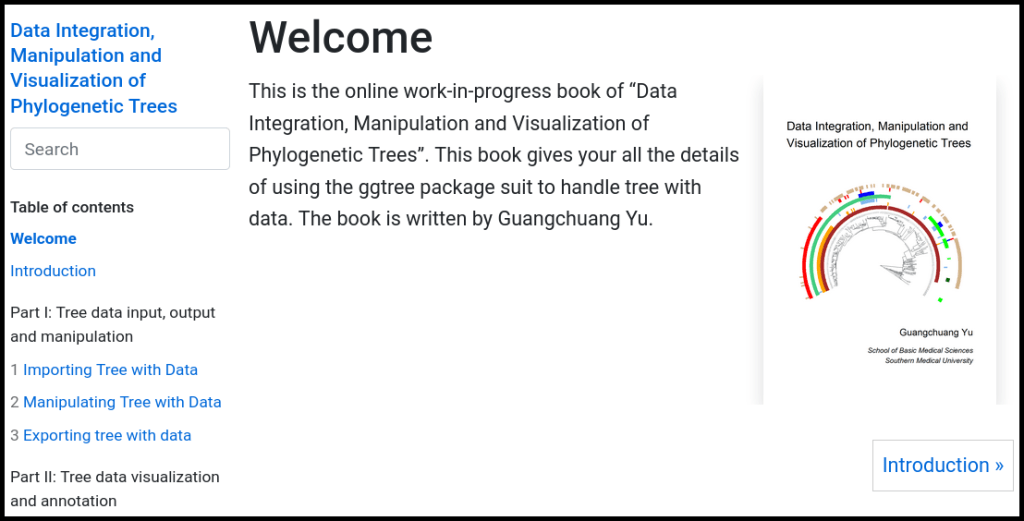
ggtree is a programming library, so the documentation to guide users is very important. An online book, entitled “Data integration, manipulation, and visualization of phylogenetic trees” (available here) is being drafted to document almost all the aspects of the ggtree package in details. As ggtree gained considerable recognition by the scientific community, GY was invited by William Pearson to publish a protocol paper on the Current Protocol in Bioinformatics journal.
To find out more about visualization and annotation of phylogenetic trees, read the Methods in Ecology and Evolution article, ggtree: an r package for visualization and annotation of phylogenetic trees with their covariates and other associated data and also check out the ggtree website.
Find out about the Methods in Ecology and Evolution articles selected to celebrate the other volumes and our editors’ favourite papers in this collection of MEE blog posts.

Hi Daniel,
The phylogenetic tree visualization with multivariate data that you presented here is splendid and spectacular!