Post provided by Takahiro Shimada and Mark G. Meekan
The cover of our February issue shows a flatback sea turtle (Natator depressus) leaving a nesting beach, fitted with an accurate Fastloc‐GPS tag. In this post, Takahiro Shimada and Mark G. Meekan explain how they analysed turtle tracking data to demonstrate their new method for assessing appropriate sample sizes in the article ‘Optimising sample sizes for animal distribution analysis using tracking data’.
Satellite tracking has revolutionised our view of the movements and ecology of marine animals. It is particularly useful for determining the spatial distribution of a species, which is essential for management and conservation. But tags are expensive and attaching them to target species is always an invasive procedure. So, it is critical both for the welfare of our animal subjects and for cost-effective field programs that we know precisely how many tags are required to adequately describe distribution patterns.
How many tags are enough?
To date, calculations of optimal samples sizes for tracking data have been forced to assume that animals use areas in a homogenous (i.e. an equal) way. This is obviously unrealistic – animals may be concentrated in areas where food is abundant, whereas areas with scarce food may be used less frequently. Clearly, we need a new way to calculate sample sizes that takes these spatial differences into account.
A new, probability-based estimate for sample sizes
In a distribution study, each new track that is reported by a tag improves existing knowledge. However, not all tracks are necessarily of the same value to the project – some individual animals might travel to a completely new area, whereas others simply repeat movements of animals that were tagged earlier. This provides a probabilistic framework for the calculation of sample sizes. We can estimate how much new tag deployments will contribute to improving our knowledge based on the probability of these additional tracks being located within known areas occupied by the species. This is very useful, because we no longer must assume that movements are homogenous as we did in the past and we can now account for variation in the use of space.
Illustration of the methods and application to a real-world data set
Some conceptual models show how this idea works. Adding more tagged animals can increase the collective area used by a species (the existing method, plot on the left below). However, if most of the area revealed by new tags just covers existing tracks, the probability of overlap of tracks will trend to towards 1 and asymptote (plot on right below). This gives an objective means of determining appropriate sample sizes that considers variation in space use.

We show how this method works using a large field data set of satellite tracking of flatback sea turtles, Natator depressus. Like many species of sea turtles, (and indeed, many taxa of marine megafauna) flatbacks are exposed to anthropogenic threats such as habitat loss, climate change, boat strikes, and pollution. Descriptions of spatial patterns of distributions are essential if we are to manage populations better, but it is also imperative that our field programs provide minimal disturbance to these animals, particularly because tagging involves the capture of nesting females. The plots below show how our method contributes to this goal.
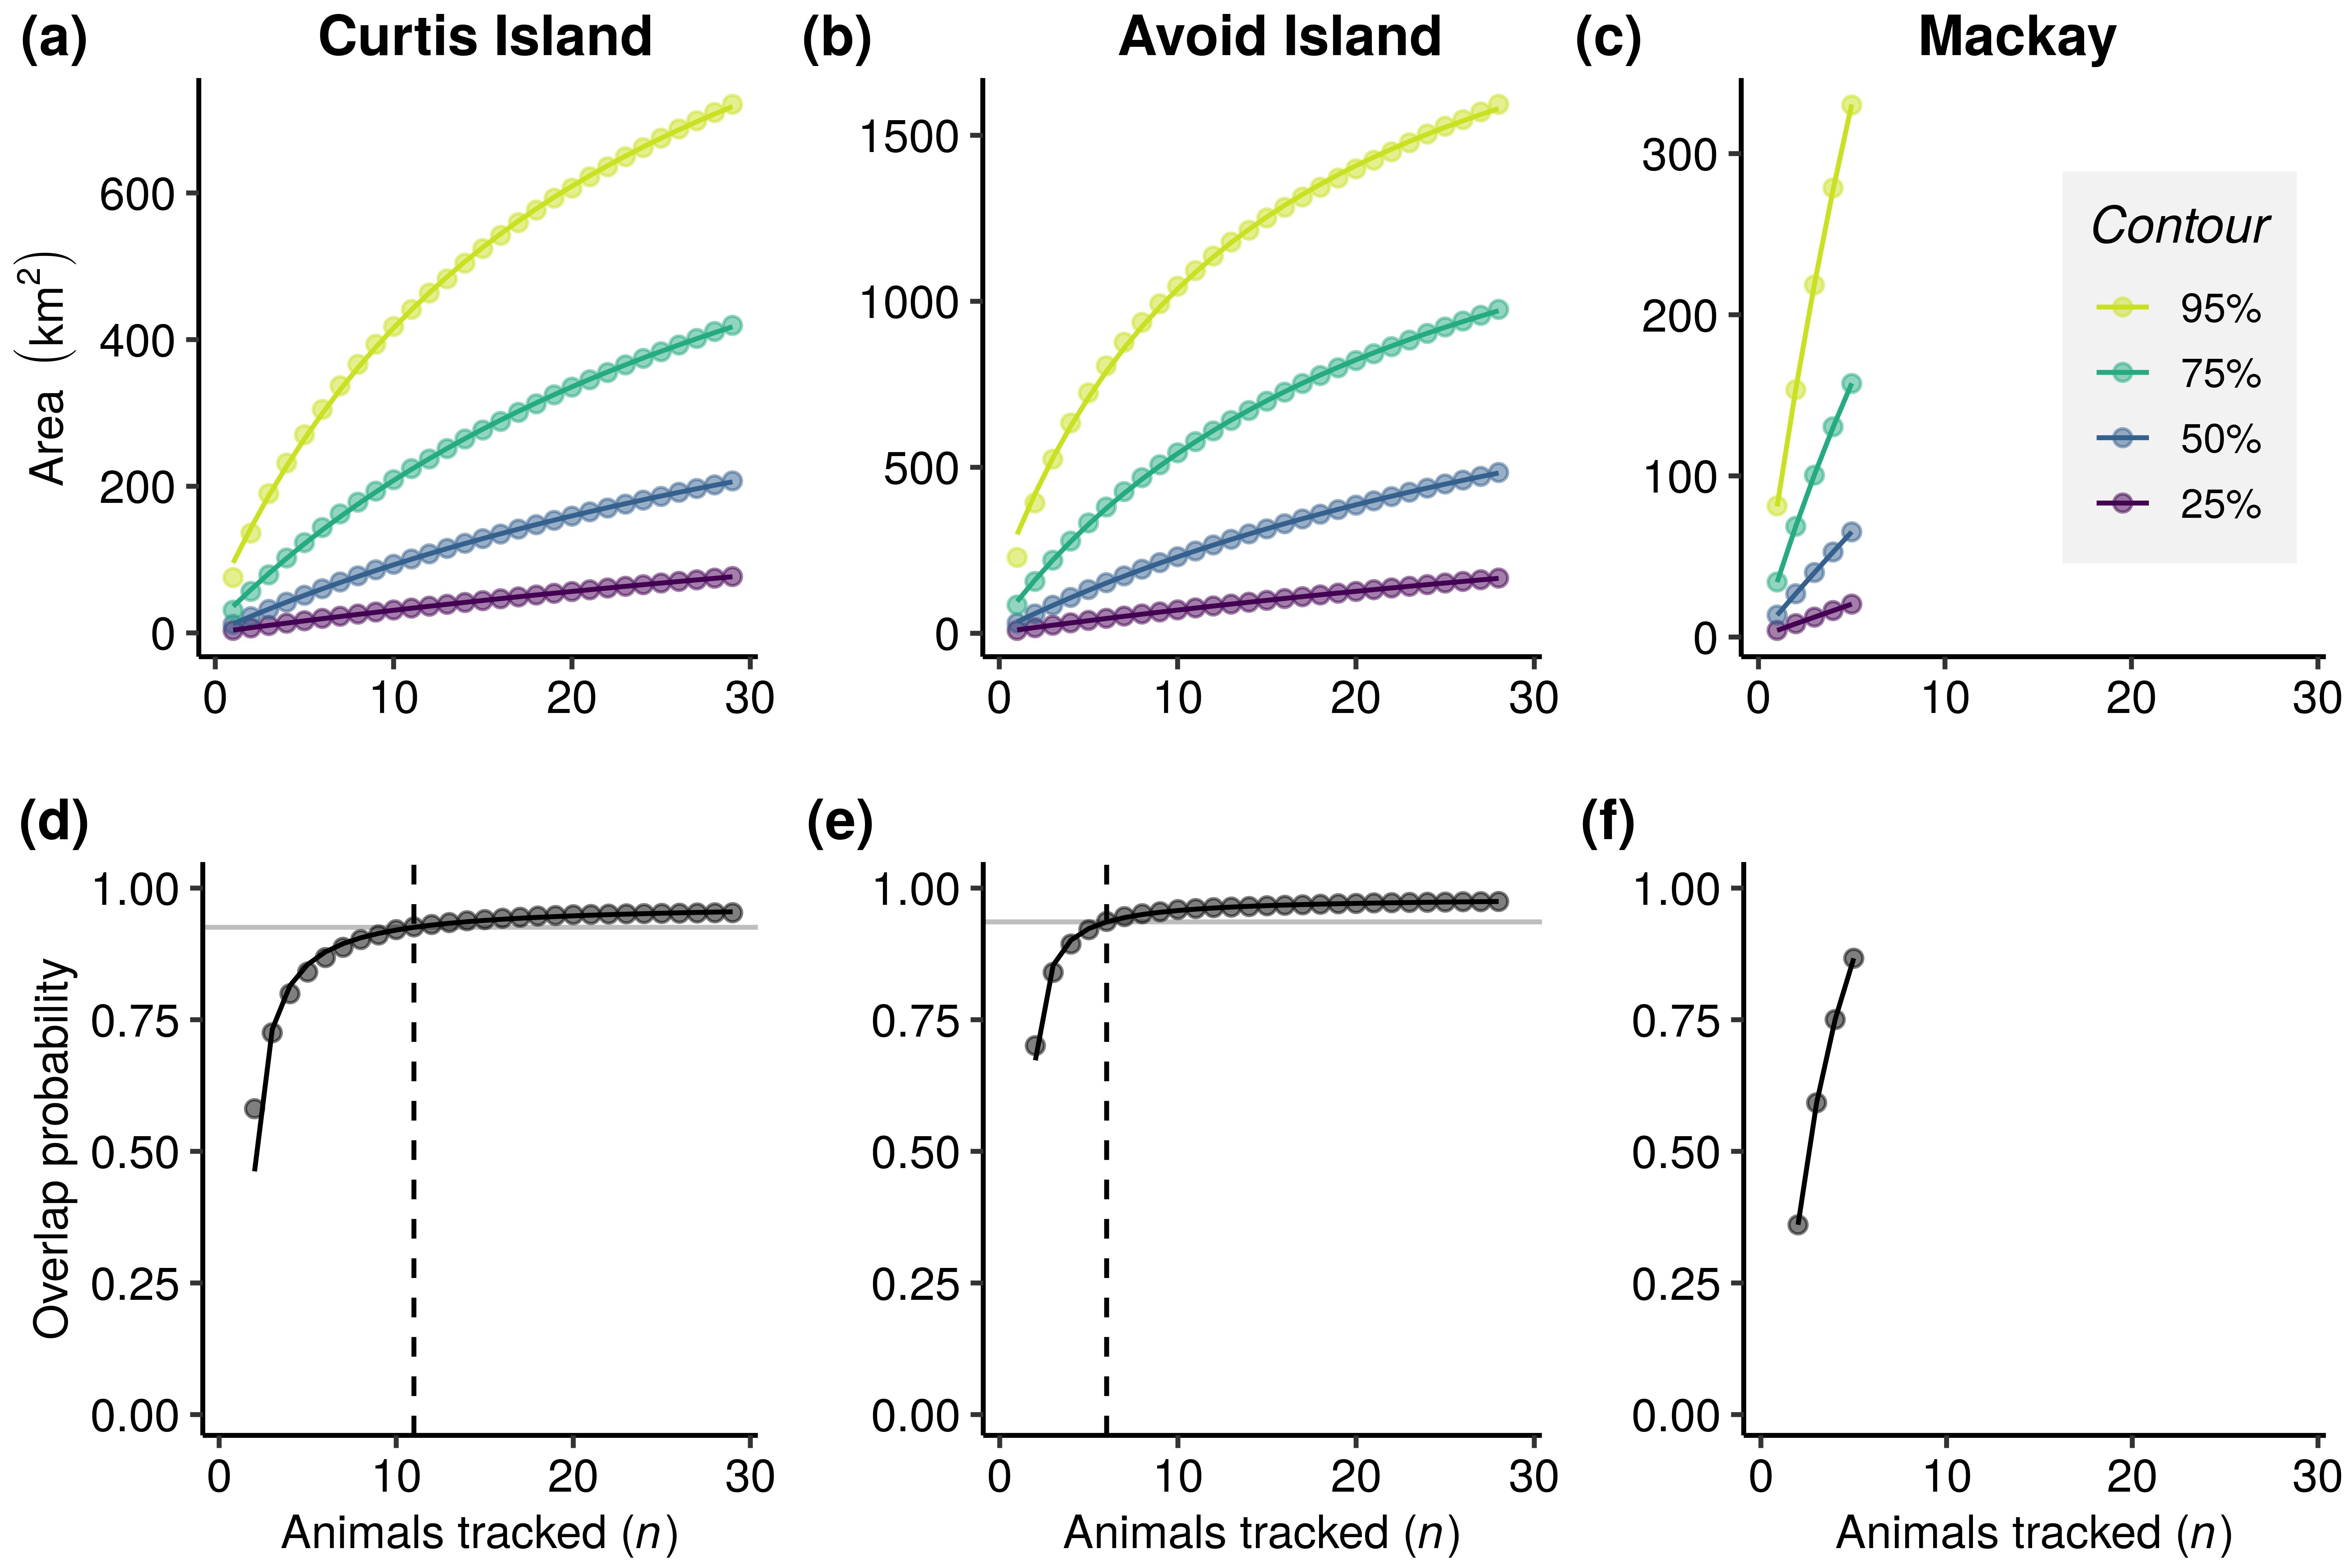
Plots a & b show the calculated areas used by the species based on curves of mean collective areas at increasing sample sizes from two study localities (Curtis and Avoid islands). These areas are calculated from volume contours of utilisation distributions (UD) of 95% (yellow line), 75% (green line) 50% (blue) and 25% (purple). Note that these increase without approaching any asymptote. Plots d & e show curves of mean overlap probability of the same data sets at increasing sample sizes calculated from the 100% UD. Each point on the curve is a mean value calculated from 1,000 random permutations and curves are rational functions fitted to these mean values. Once the fitted curve attains 95% of the estimated horizontal asymptotes (horizontal grey line), the sample size (as indicated by a dashed line) is likely sufficient to characterise spatial distributions.
SDLfilter R Package
Although we use the example of sea turtles, our new method has broad applicability for the post-hoc validation of sample sizes of tracking data across a wide range of taxa, populations and life-history stages of animals. To facilitate use of our technique, we compiled the method in the R package SDLfilter, available on CRAN (stable version) and the GitHub repository (developmental version). An example of use of the package is provided in the GitHub page, which is actively maintained and developed.
To read the full study, see our Methods in Ecology and Evolution paper, ‘Optimising sample sizes for animal distribution analysis using tracking data’.
To read all articles from the February 2021 Methods in Ecology and Evolution issue, visit the journal website here.
