Post provided by Ian Durbach and Koustubh Sharma

Snow leopards are notoriously elusive creatures and monitoring their population status within the remote, inhospitable habitats they call home, can be challenging. In this post, co-authors Ian Durbach and Koustubh Sharma discuss the applications of their Methods in Ecology and Evolution article, ‘Fast, flexible alternatives to regular grid designs for spatial capture–recapture’, for monitoring snow leopard populations.
In 2017 the governments of all 12 countries where snow leopards are found formally endorsed a plan to develop a global snow leopard population assessment. This ambitious initiative, called PAWS (for the Population Assessment of the World’s Snow Leopards) and coordinated by the Global Snow Leopard Environmental Protection (GSLEP) program, aimed to produce a scientifically robust population estimate within 5 years.
Camera trap deployment

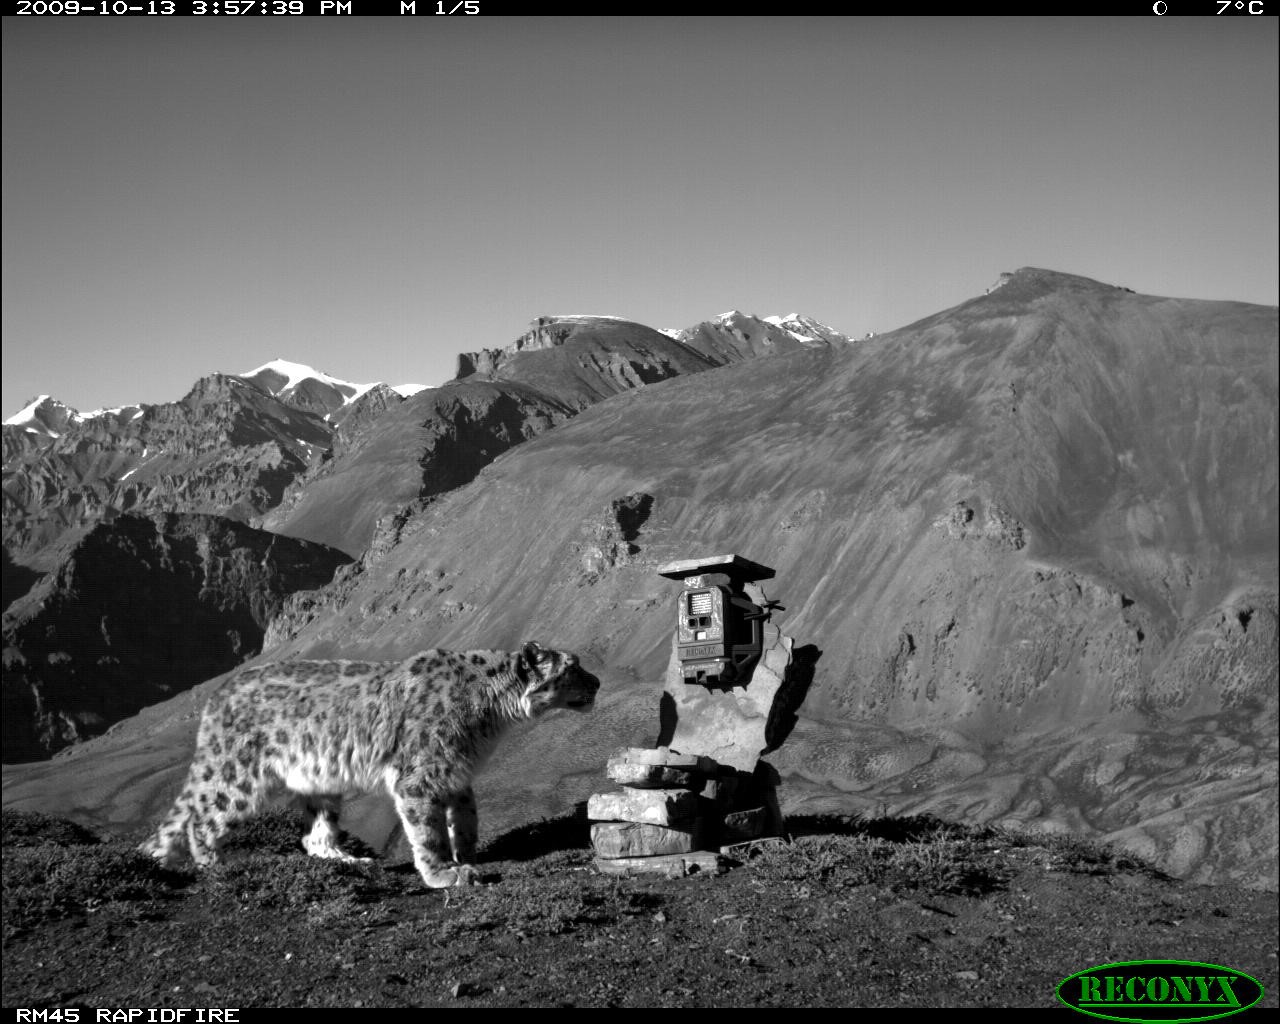
Camera trap surveys analyzed using spatial capture-recapture methods are the foundation of the assessment. The survey effort itself is highly devolved. The estimated size of the snow leopard’s distributional range is nearly 2 million km2, with the largest share in the Tibetan plateau of China, followed by Mongolia and India. Each country has its own governmental and non-governmental organisations conducting their own surveys with their own resources. A question faced by all teams each time they do a survey is “where should the cameras go?”.
As part of the PAWS technical advisory panel, this was a question we were being increasingly asked towards the end of 2018. Traditional design guidelines weren’t well suited to surveying snow leopards. Snow leopards tend to occupy extremely rugged, mountainous terrain. In the Himalayas, to ask a field team to visit a grid of regularly spaced locations is often impossible. Snow leopards are also famously elusive, especially for humans, but also for cameras. A typical response was to arrange cameras closer together in loose clusters, with clusters separated say by a high-altitude ridge or valley. A seemingly sensible response to a challenging problem, but we wondered whether better designs were possible.
Optimal designs for spatial-capture recapture studies

The first step to designing better surveys is to say exactly what “better” means. This is the job of optimal design, which optimizes a numerical criterion, usually a desirable statistical property of the design. For wildlife surveys focusing on animal density (or abundance), an ideal statistical criterion is the mean square error (MSE), the expected squared difference between the estimator of density and its true value. An estimator’s MSE is equal to the square of its bias plus its variance. Spatial capture–recapture (SCR) estimators have been shown to be unbiased under a wide range of detector arrangements, so another reasonable design criterion is estimator variance, to be minimized.
Until recently, the only way to calculate the variance of density estimators was by computationally demanding simulation. Optimizing detector locations requires repeating this simulation tens of thousands of times, which takes too long to be practically useful. This created an impasse: finding designs that optimized classical measures of statistical accuracy was computationally impractical. The best that could be done was to optimize other criteria with uncertain relationships to estimator precision or to fall back on established rules of thumb.
Faced with this dilemma in 2019, we came across this paper by Murray Efford and John Boulanger. It contained exactly what we needed: an approximation that could be used to quickly calculate the variance of a density estimator. The approximation itself is interesting. It says that variance is a function of whichever is the smaller of the number of unique animals seen (n), and the number of recaptures (r). Minimizing variance is a balancing act between these two quantities.
We couldn’t believe our luck. Here was a way to find the precise locations of detectors that would optimize a widely accepted measure of statistical quality. Even better, the inputs to the approximation could be calculated for a wide range of SCR models, for example, those that allow animal density or detectability to vary spatially. Optimal designs would be available for all of these extended contexts.
Why SCR design is hard
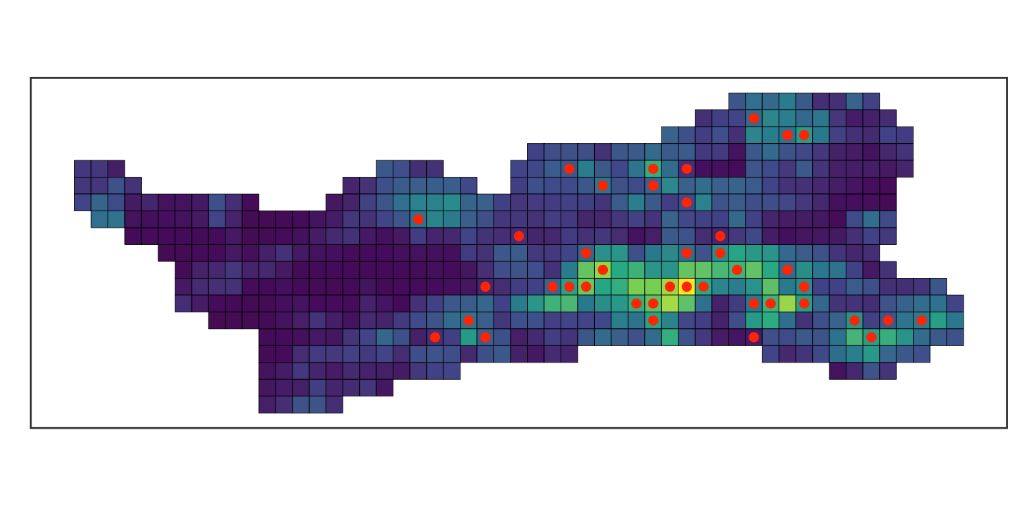
We implemented an optimization routine to generate designs that minimize the approximate variance of density estimates. There are various ways to do this. We used a genetic algorithm, and called the result min(n,r) designs. To test our approach, we used an existing snow leopard camera trap survey, but the method is applicable to any survey used to generate SCR data, such as those conducted with hair snares or live-capture traps.
As usual, what seemed straightforward turned out not to be that at all. The approximation was developed for detector arrays with regular spacings between detectors. It works slightly less well if detectors are allowed to be placed anywhere. This meant that sometimes, although the optimized design returned bigger sample sizes (more unique animals and more recaptures), this did not always translate into lower variances. Gains were possible, but these were typically modest and occurred where the variance was already small. Using a standardized measure of variance called the coefficient of variation, optimized and regular grid designs were usually within a few percent of one another.
The reasons behind this are intriguing and provide a starting point for further research. Optimized designs that don’t impose regular spacing between detectors often ended up with less precise estimates of the movement parameter sigma. This is something not accounted for in the approximation. The root cause seems to be that the approximation treats any recapture as equally “valuable”. This encourages detectors to be closer together, which is good for getting more recaptures but bad for estimating sigma, which depends on recaptures being observed across a range of distances.

Turning these thoughts into an improved approximation would be a big step towards a truly optimal design for SCR surveys. In the meantime, the main benefits provided by min(n,r) designs are a transparent process that reduces the need for difficult and subjective design decisions, flexibility with respect to survey region, precision that is competitive with grid designs, and the ability to build in prior knowledge about environmental covariates affecting density, detectability and movement.
Back to the field

The true test of any survey design is how well it works in practice. We’re now regularly using the min(n,r) approach to design new snow leopard surveys for PAWS. We think of min(n,r) designs as good, flexible candidate designs rather than as “optimal”. We include them alongside designs optimizing other criteria, as well as more traditional SCR designs. We compare their expected performance using simulation, for example with the R package secrdesign. We have frank discussions with field teams about the practical details of implementing a design. Detectors are often moved around a little to make life easier for field teams or to incorporate some local knowledge of the survey region. The final design is often a compromise between all of these factors. Snow leopard survey design remains highly pragmatic, but we’ve found min(n,r) designs to be a useful addition to the SCR toolbox and a stimulating way to think about the challenge of optimal SCR survey design.
To read the full study, see the Methods in Ecology and Evolution article, ‘Fast, flexible alternatives to regular grid designs for spatial capture–recapture’ recently published in the February 2021 issue.
