Post provided by Valerie Steen
Each year Methods in Ecology and Evolution awards the Robert May Prize to the best paper published in the journal by an author at the start of their career. Ten Early Career Researchers made the shortlist for this year’s prize, including Valerie Steen who is a Postdoctoral Researcher at Oregon State University in the USA. In this interview, Valerie shares insights on her paper ‘Spatial thinning and class balancing: Key choices lead to variation in the performance of species distribution models with citizen science data’.
Tell us your career stage, what you work on, your hobbies and interests
I am a Postdoctoral Researcher, at Oregon State University. I work on tools for better predicting species distributions and detecting population declines given noisy data. Currently, I am researching the ability of multi-state occupancy models to detect population declines when animals have low detectability and counts contain extra heterogeneity.
My hobbies and interests include salsa/bachata dancing, authentic relating practices, and experiencing the outdoors through hiking, backpacking, floating, running, and Nordic skiing.
How would you pitch your article to someone if you had just 30 seconds in an elevator?
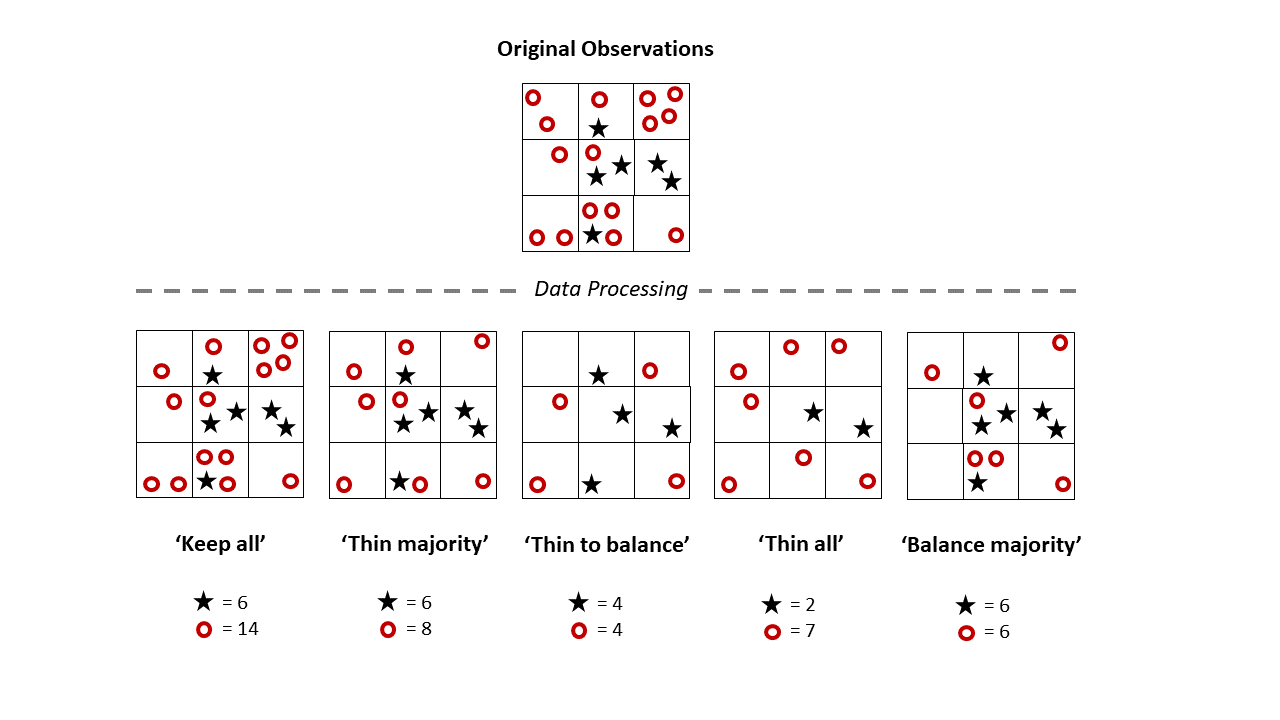
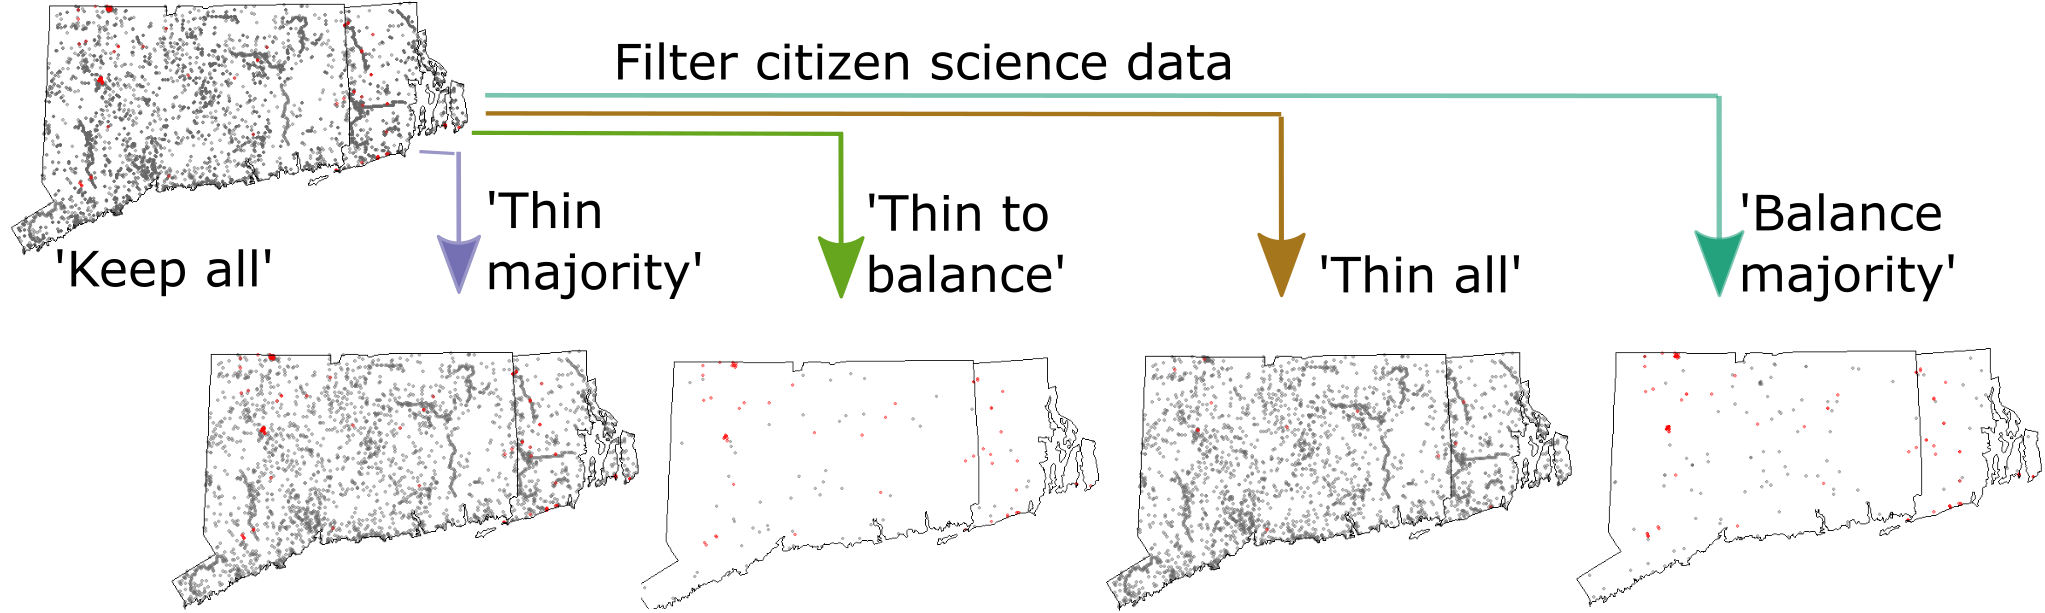
We looked at rulesets for subsampling citizen science data to create an optimal dataset for modeling species distributions. The main considerations are whether to: use all the data, keep only all the presence data, spatially thin to remove potential spatial biases, and/or balance presence and absence classes.
We looked at 102 breeding bird species in the Northeastern U.S. and considered whether species rarity impacted what ruleset was optimal, given the modeling algorithm used and the intended use of the model predictions. We found that there is no single best dataset, and that the best dataset(s) depend on all the factors we considered. However, our findings emphasize the importance of knowing from the beginning how research output will be used.
Where did the idea to develop this method come from?
We were interested in some earlier research that had found retaining all detections and spatially thinning non-detections produced the best species distribution model for a rare species. Fortunately, we had access to a large, systematically collected, independent dataset. We saw this as an opportunity to independently test species distribution models created from different thinning and balancing rulesets, plus we could expand on the previous research by including species of varying prevalence and multiple modeling algorithms.
What were the major challenges in developing this method? How did you overcome this?
Because we had worked with over 100 species, five data sampling rulesets, four different modeling algorithms, and five different performance metrics, a major challenge was summarizing the results into straightforward guidance for future researchers to use.
We initially came up with a decision tree because – by its nature – it can step users through multiple layers of decisions to arrive at an answer. This was the great suggestion of our Associate Editor. Ultimately, we decided to use a table which displayed the multiple dimensions of the problem clearly.
How do you plan to apply the method you published/what have you been working on since its publication?
I have used our recommendations from this paper when I was selecting data to model wintering bird distributions for the Rhode Island bird atlas. Without the guidance of this paper, I probably would have used a data subsampling routine that was much more complicated than our paper recommended.
Since the publication of this paper, besides the Rhode Island bird atlas, I have worked on modeling bird population trends for the Chicago metropolitan area. Currently I am researching the ability of multistate occupancy models to model an ‘abundant’ state (as well as occupied and non-occupied), and detect declining population trends. I am applying this to fish populations of the San Francisco Estuary. This has involved months of running simulations, but now the draft manuscript is almost finished.
Who will benefit from your method?
I think scientists who use citizen science data (or other non-systematically collected presence/absence data) to map species distributions will benefit from our recommendations because it simplifies – what can be – a complicated decision process.
Species may benefit as well. Optimal data subsampling should give better species distribution predictions which can help improve land conservation decisions.
If you could travel back in time, would you add to or change anything about your method?
I would probably remove one performance metric called precision-recall AUC. Although the properties of the metric had it seem appropriate to include, it had not been vetted widely in the species distribution modeling world and the results from this metric were hard to interpret. Plus, we had already included four well known and popular metrics.
You can read Valerie’s full paper here.
Learn more about the Robert May Prize 2022 shortlist here.
