Megan Laxton and colleagues originally set out to translate an existing example of a species distribution model into a new software framework. However, what originated as a simple modelling example developed into a discussion on structural complexity in species distribution models.
Complexity in Species Distribution Models
The original idea for our paper was to provide a worked example demonstrating the usage of the R package inlabru to fit a marked point process model to species distribution data. A marked point process model is used to model the spatial (or spatiotemporal) distribution of events and their associated characteristics.
Inlabru is a user-friendly wrapper around and extension to the existing package INLA, which can fit a wide range of complex statistical models and is – due to its computational efficiency and flexibility – particularly suited for complex spatial and spatiotemporal model fitting. The package was originally developed with the complex datasets and observation processes commonly found in ecological applications in mind, so there is a drive to provide applied ecological examples of the software in action.
However, as is so often the case in research, what aimed to be a simple example of an applied model turned into a far more complicated problem. The predictive and visualisation methods of inlabru highlighted unusual features of the model predictions, prompting further investigation into the model structure. This led to the development of a paper which analyses four successively more complex models, asking the question: when is increased complexity beneficial, and when is it not?
Patchy Habitat
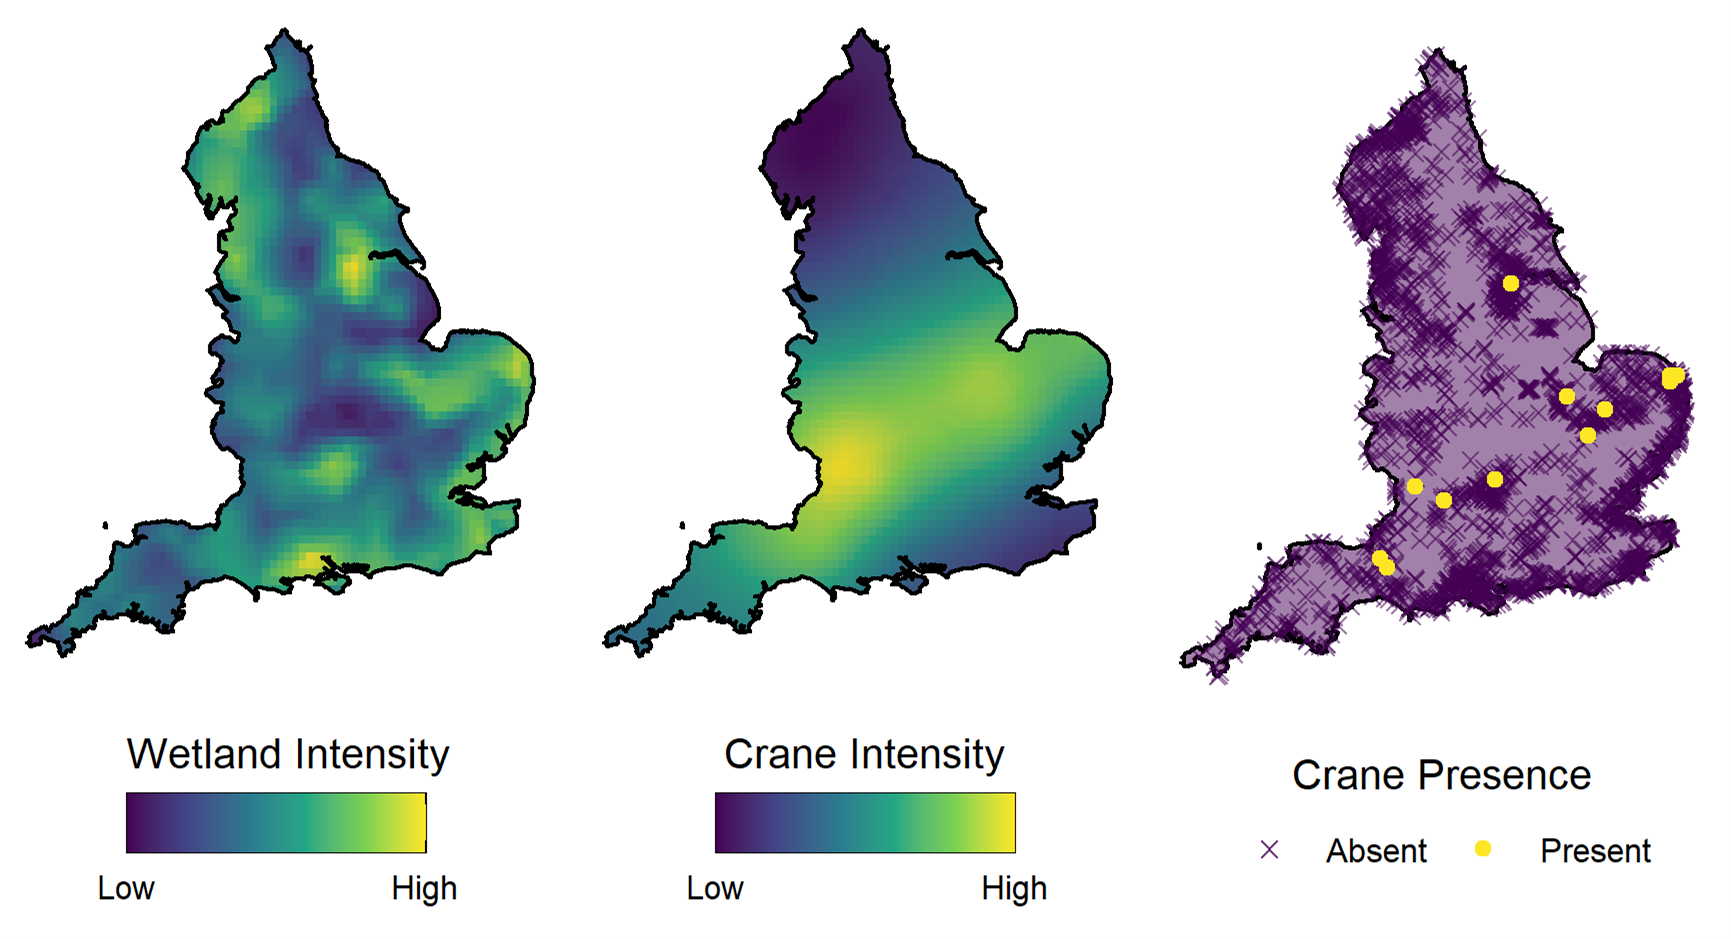
Our example looks at the distribution of Eurasian cranes (Grus grus) in the UK. Crane breeding pair nests are only found in wetland habitats, so wetlands can be seen as ‘habitat patches’ for this species – areas of suitable habitat broken up by interstitial areas of unsuitable conditions.
Habitat patches influence species distribution by creating a restriction on the spatial locations at which the species can be found, breaking up the study area. At a larger scale, the density of these patches can also influence the distribution of a population by factoring into which general areas are deemed preferable by containing higher densities of suitable habitat.
In our paper, we use marked point process modelling to model both the distribution of the wetlands and the distribution of the cranes in a joint model. We utilise separate random effects to account for the spatial structures of the wetlands and cranes. This allows us to both account for the restrictions on the spatial distribution of the habitat, and to see the spatial connectivity in the population which is independent from the distribution of the underlying habitat patches.
Setting up the model in this framework and including these spatial effects is an example of structural complexity in a model that is founded in ecological realism and improves model interpretability. However, not all model complexity provides such an improvement.
Reintroductions and Invasions
We are often interested in modelling the distribution of species that have been recently (re)introduced to an environment, to estimate how the population might spread. This is the case in our crane example; the species was historically extirpated and recently reintroduced to the UK.
The data used in the example are characteristic of the type of data collected early in a (re)introduction; containing few observed presences of the species, which are clustered closely in space. This meant that our observations of the overall spatial distribution of the species differed very little between years, creating an issue when including a temporal correlation effect in the model.
The most complex model considered in our study actually produced inaccurate and misleading predictions. This is an example of when data can be insufficient to support certain model components, so adding complexity actually inhibits study aims.
Complexity for Complexity’s Sake?
Including complex model components can allow us to better represent population dynamics and habitat preferences in species distribution models, improving predictive accuracy while maintaining interpretability of results. However, the relationship between model complexity and ecological understanding is not linear; including some complex model components can lead to inaccurate predictions if we are not vigilant. Increasing model complexity requires a careful consideration of the role of each model component, how it is supported by the data, and how its inclusion impacts model outcomes and predictions.
You can read the full article here
