
Post provided by Brooke Bond (Gibbons)
Ecologists often dream about big datasets—Combining observations from multiple studies across space and time could reveal patterns that would otherwise be impossible to detect. But anyone who has tried to merge datasets from different sources knows the reality is often less glamorous.
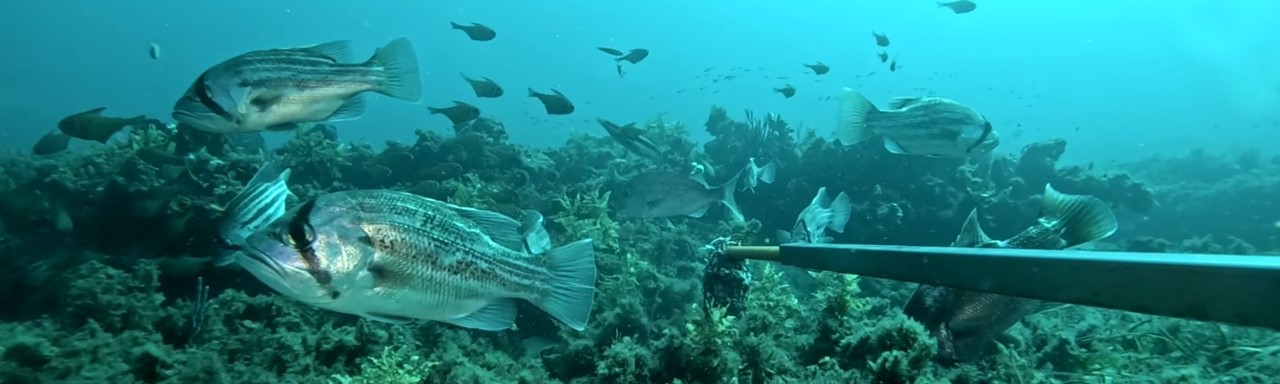
My first job involved synthesising Baited Remote Underwater Video (BRUV) datasets from across Australia. BRUV systems use underwater cameras and bait to record fish and habitat, allowing researchers to identify species and measure body size directly from video footage. Over the past two decades, this approach has become widely used because it is cost-effective, produces a permanent record, and enables species identification back in the office.
In early 2018, I was handed datasets from researchers around Australia and asked to combine them into a tidy format before a national BRUV workshop. At first, the task sounded straightforward; simply combine everything together so everyone could start analysing the data and writing papers.
Then I opened the files.
The reality of combining datasets
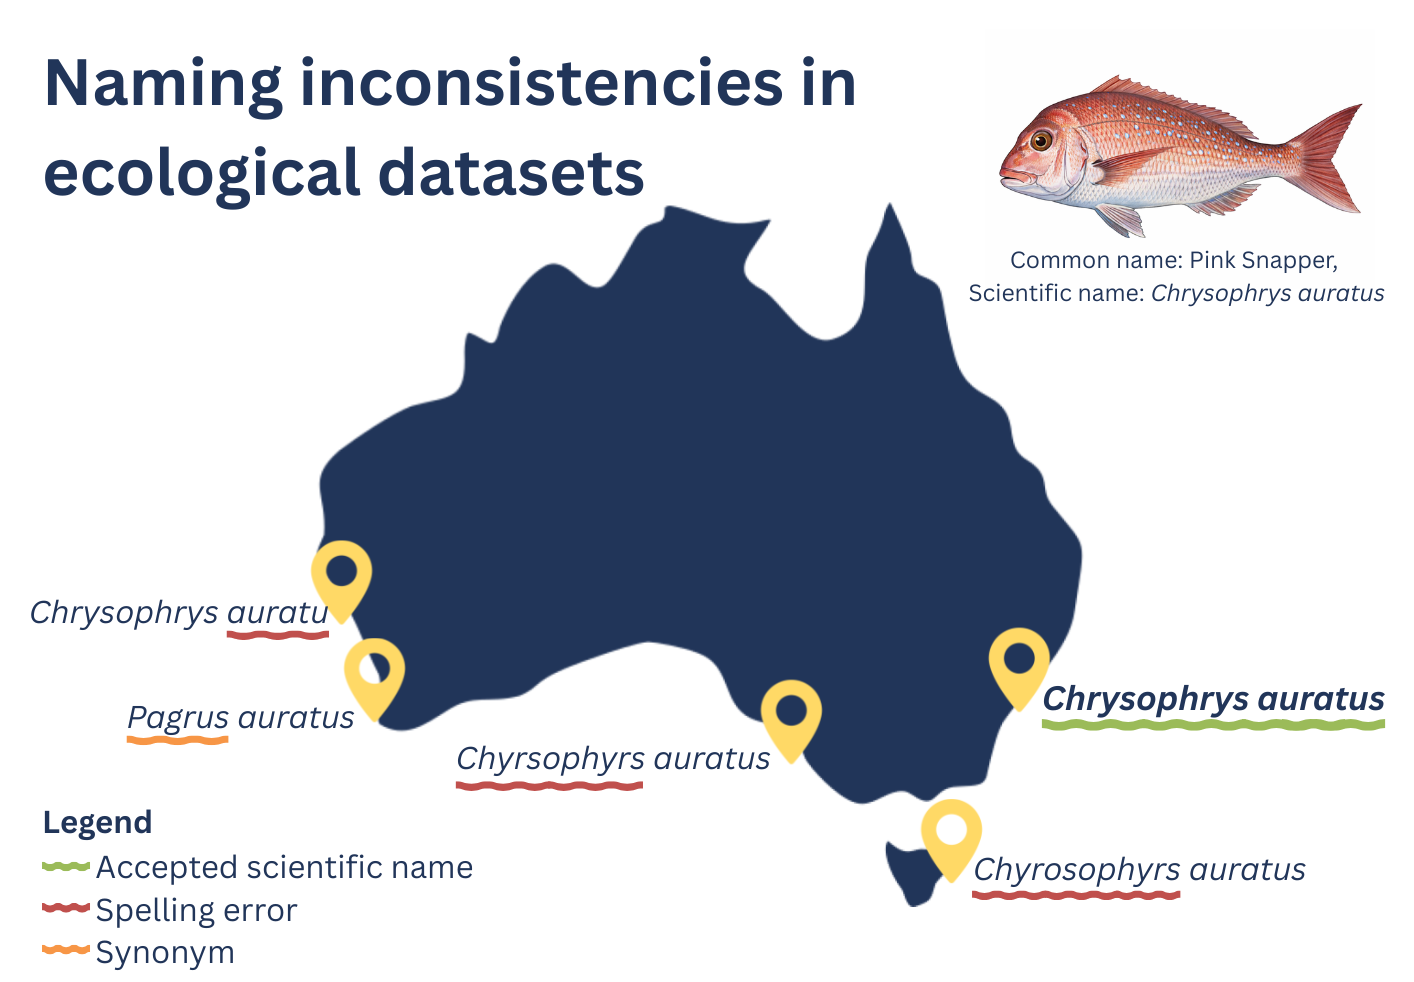
The synthesis ultimately combined 19,939 BRUV deployments collected by 32 researchers across 12 institutions (Harvey et al. 2021). The final dataset included over 1.16 million fish observations and 373,000 body-size measurements. Each group had followed broadly similar survey methods, but the way the data were stored, annotated, formatted, and exported varied. Some datasets used different species names, spelling variations, or legacy taxonomy, highlighting the challenges, and opportunities, of harmonising records collected across multiple programs and decades. Every now and then we came across an obvious entry error that made us laugh and contact one of the collaborators to fix it up. These experiences reinforced the value of clear protocols, quality control, and communication when bringing together observations collected by many different teams.
To help detect, flag, and communicate common issues, we started writing code. As we encountered new problems, the code gradually grew more complex.
From code to a community tool
What began as a solution for one workshop slowly evolved into a broader set of quality-control tools for the broader community. Despite researchers following the same field manuals, combining datasets revealed many recurring data issues that had previously gone unnoticed.
Then the COVID-19 pandemic arrived.
With fieldwork paused, we suddenly had time to revisit the code and think about how it could become useful beyond our own project, and accessible for people without coding skills. So we turned the workflow into a web-based application.
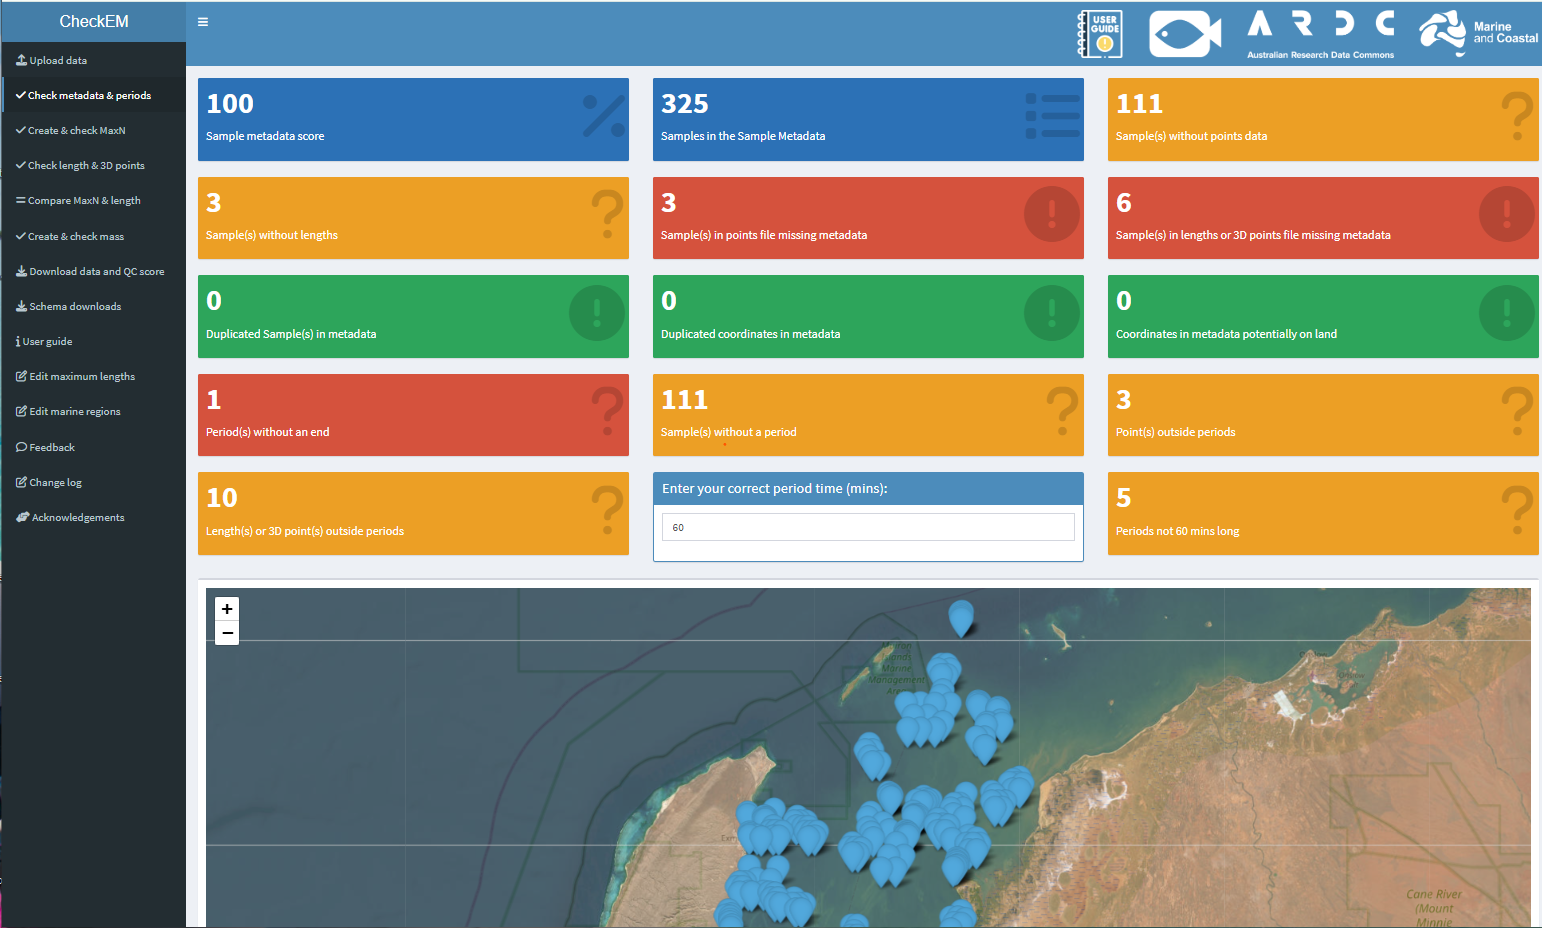
This became CheckEM, short for Check EventMeasure, an annotation software commonly used for stereo-video surveys. The goal was not to automatically “fix” data, but to help researchers easily identify potential issues and fix their annotations before analysis begins.
Today CheckEM is available both as an interactive web-based application and as an open-source R package, allowing users to integrate the checks directly into their workflows.
What CheckEM checks
CheckEM compares uploaded survey data against taxonomic and biological reference information.
For example, it can:
- detect outdated or misspelled scientific names
- flag species observed outside their known distribution
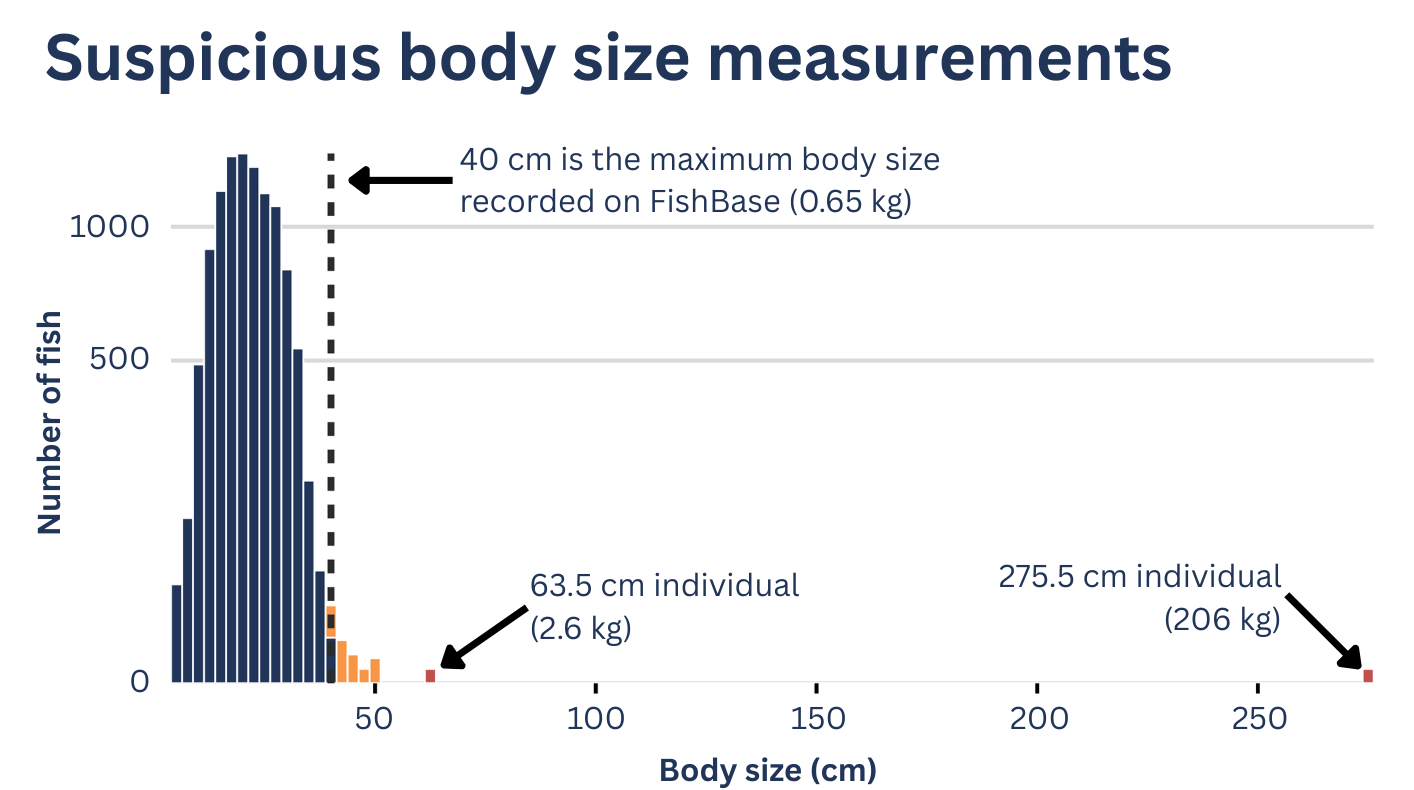
- identify fish measurements larger than the maximum recorded size
- highlight missing or inconsistent metadata
- generate error reports and summary datasets
Importantly, CheckEM does not automatically modify the data. Instead, it flags suspicious entries so researchers can return to the original annotations or imagery and verify them. Sometimes these flagged observations really are errors. But occasionally they reveal something interesting, such as a genuine range extension or an unusually large individual.
Why data quality matters
Modern ecological research increasingly relies on large, synthesised datasets to understand environmental change at regional or global scales.
Even small errors can influence results. For example, an incorrect body-length measurement can dramatically affect biomass estimates. Ensuring data quality before analysis is essential for producing reliable conclusions. Real validated outliers often form the genesis of new ideas and hypotheses. But before we embark on these new research pathways we need to be sure the data point is real and not a typo.
CheckEM helps researchers spend less time manually checking spreadsheets and more time analysing their data.
A growing collaboration
The first BRUV synthesis that inspired CheckEM brought together thousands of deployments from across Australia. Since then, collaboration within the BRUV community has continued to grow.
The BRUV workshop was repeated in 2024, bringing together more organisations and deployments while incorporating many of the lessons learned during the original effort.
The expanded synthesis now has 29,505 BRUV samples with 1.77 million individual fish, nearly 2000 fish species, over 580,000 length measurements, and over 20 environmental and socio-economic covariates are provided for each sample. Making this one of the largest national integrated marine ecological dataset ever.
As datasets grow larger and more interconnected, tools that help ensure their quality become increasingly important.
Looking ahead
CheckEM began as a practical response to a very real problem: collaborative datasets that were difficult to combine. What started as a handful of code written under time pressure has evolved into an open-source toolkit used by researchers around the world.
By making quality control faster and more accessible, we hope CheckEM will help researchers spend less time cleaning data, and more time using it to understand, manage and protect marine ecosystems.
CheckEM was supported by the Australian Government under the National Environmental Science Program Marine and Coastal Hub and the Australian Research Data Commons (ARDC), which is funded by the Australian Government through the National Collaborative Research Infrastructure Strategy (NCRIS) through the Fish and Shark Data Partnership.
To learn more about CheckEM and how it can be used for fish survey datasets, read our full paper in Methods in Ecology and Evolution.
