Post provided by Jonathan Syme
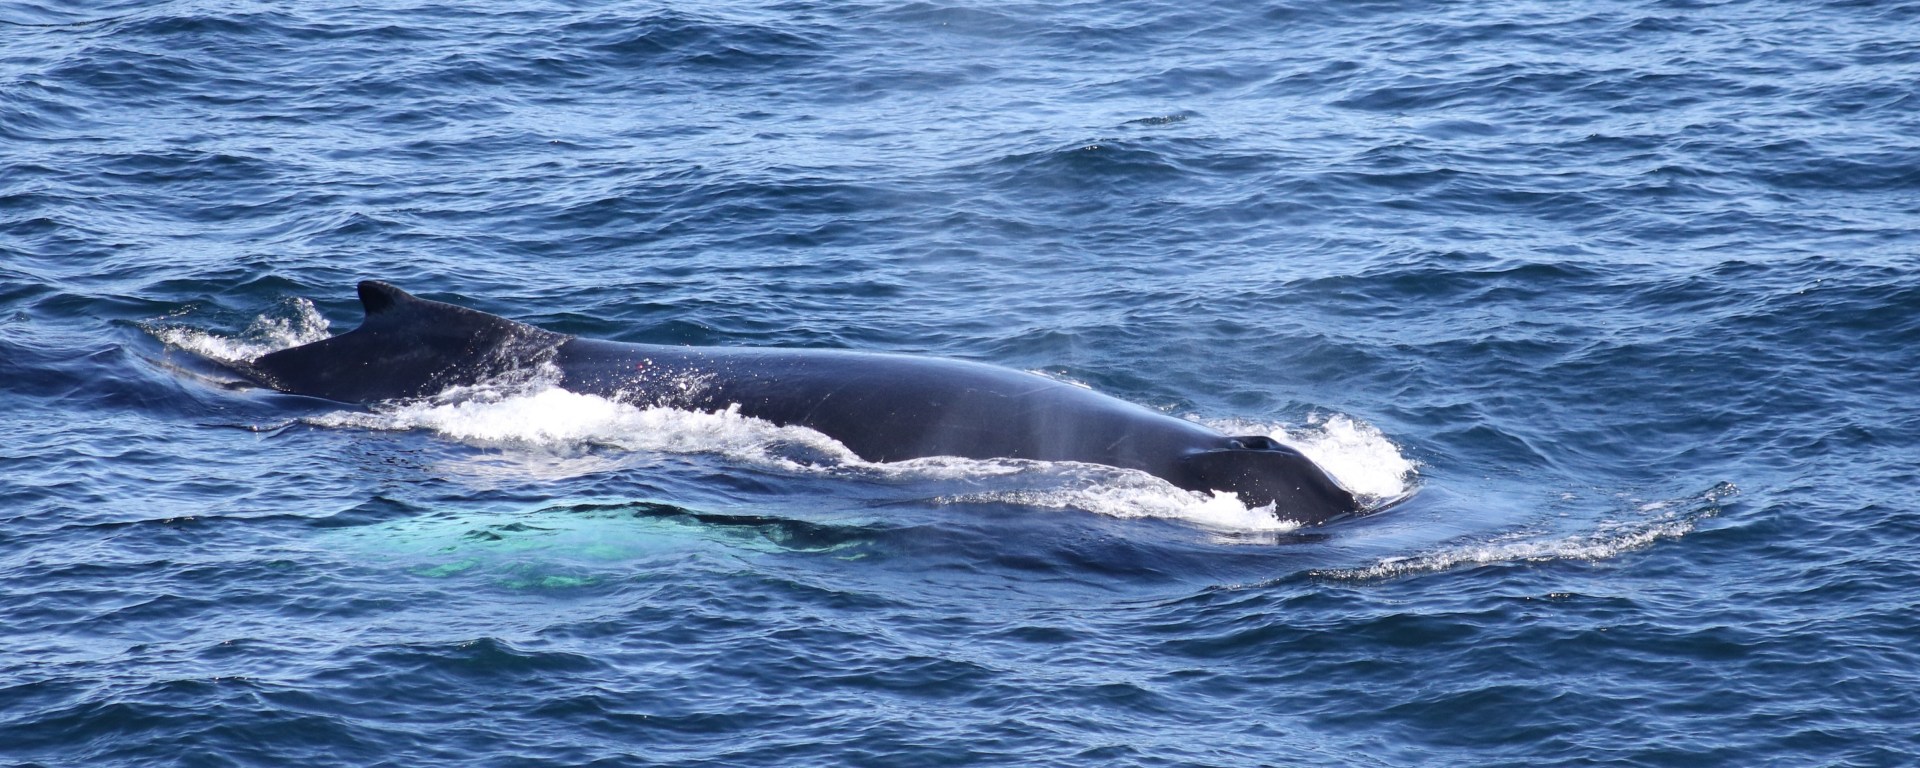
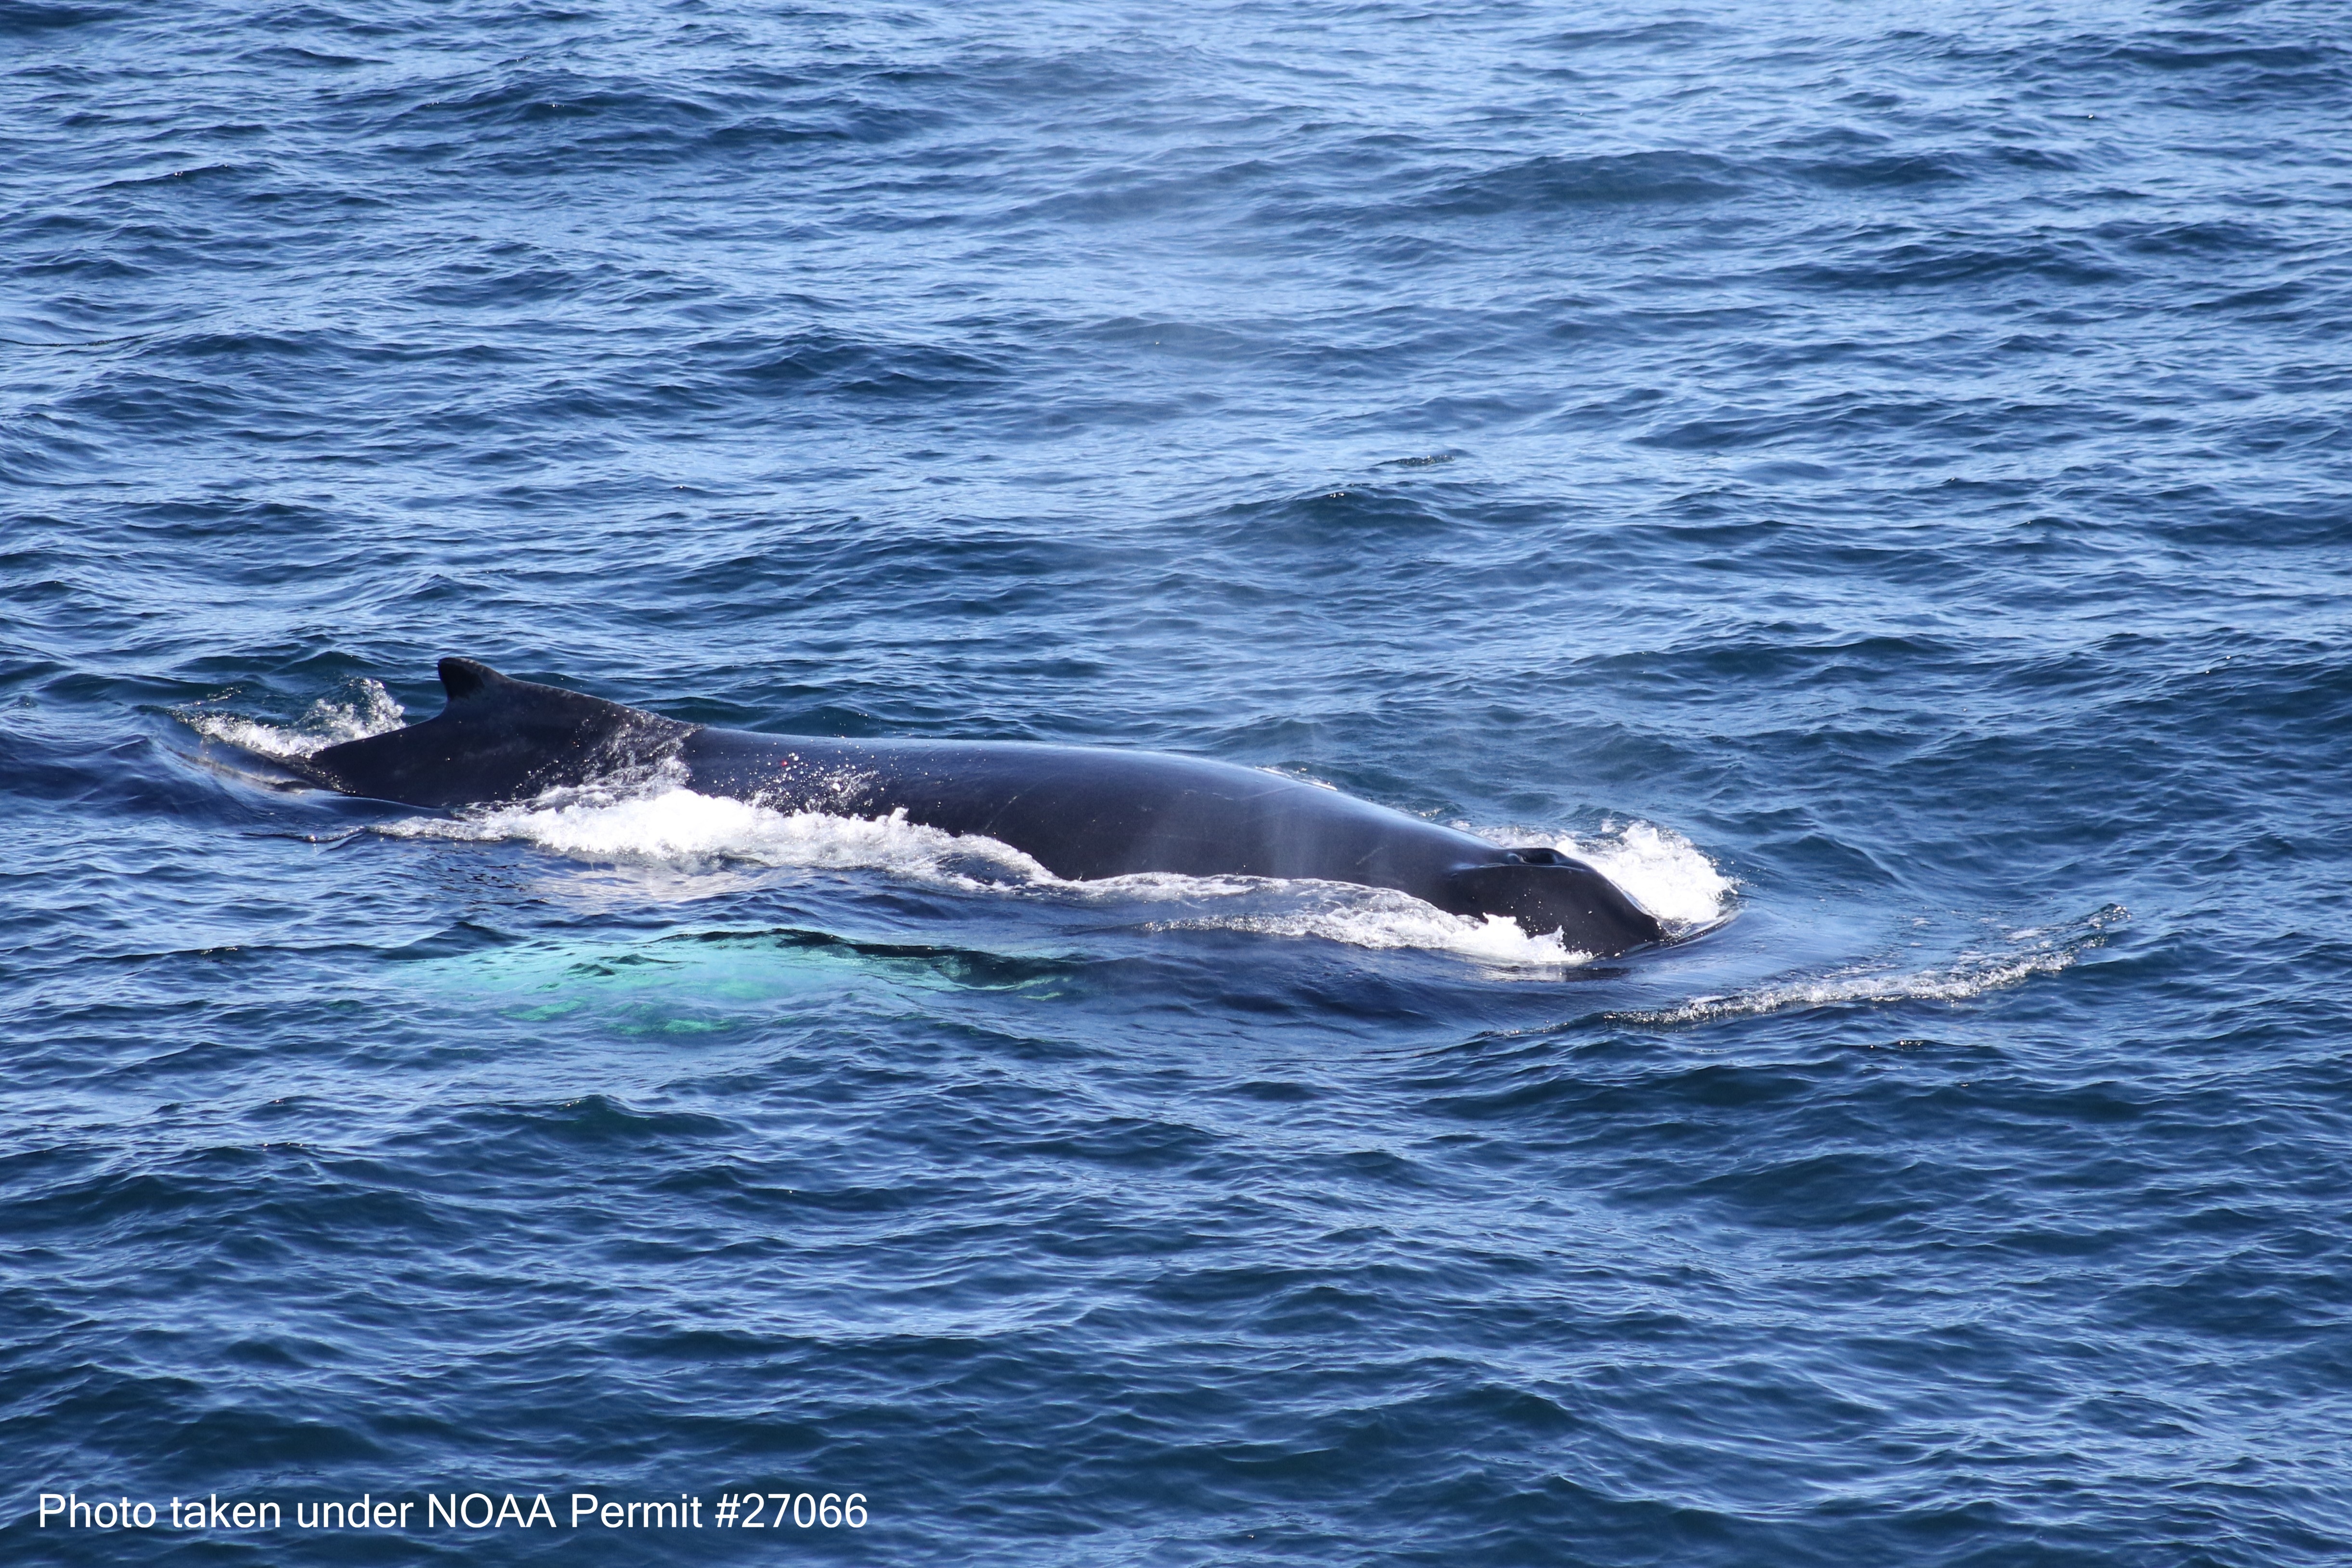
Picture this idyllic scene: You’re on a research vessel that is steadily making its way through the vast blue sea, surveying back and forth along a set of transect lines, its track recorded by a GPS. Through your binoculars, you see a column of spray, an arching back, a fluke that rises high above the water, then disappears. You call out ‘whale!’ and your colleague enters the sighting — the location, time, species — into the database.
Now picture this not-so-idyllic scene: You’re in an office steadily gaining familiarity with the vast dataset you’ve been given. The track of the research vessel is now a line that zigzags across your screen, the sighting of the whale now a dot. Your task is to analyse the tracks and sightings, the lines and dots, by building a model. But, the model requires as input a set of samples, each one representing some location in time and space where a whale was or wasn’t detected. So, before you even get to the modeling, you have a task at hand: process the tracks and sightings into samples.
Although I’ve had the good fortune to experience that idyllic scene, unfortunately for you, dear reader, this post concerns the not-so-idyllic scene, so there’ll be no more waxing lyrical about whales, or dolphins acrobatically leaping in the bow-wave, or shearwaters gliding effortlessly over glassy water… Anyway, to the point. This post is about sampley, a Python package that we developed specifically for that not-so idyllic task: processing visual survey data, such as tracks and sightings, into samples that can be put into an ecological model.
The many ways of processing visual survey data
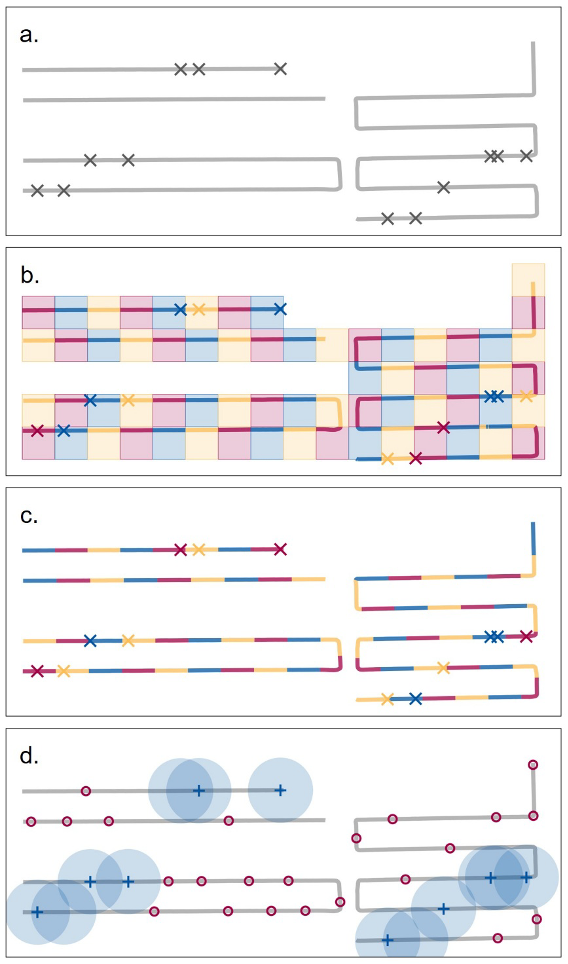
After a brief literature review, it became clear that there are many diverse ways of processing tracks and sightings into samples. You can divide the ocean into grid cells, or cut the tracks into segments, or generate points that represent presences and absences. But there was more to it than that: cells can be rectangular or hexagonal, small or large; tracks can be segmented with varying degrees of complexity and standardisation; and absence points can be generated in various ways depending on the study.
Although many papers described their processing methods, very few, if any, gave specific details about how the processing was done — What software was used? What algorithms? Most researchers have their own custom scripts that they’ve developed and that they adjust for each new project, just as I had done during my PhD and my supervisors had done numerous times before. And, although these custom scripts work, they bring a few issues. There is a lack of reproducibility, given that the scripts tend to be unpublished, as well as a considerable burden in terms of the time and know-how that it takes to develop them. That burden is only increased if you wish to trial and compare multiple ways, but, perhaps enticed by the challenge, this is what we decided to do.
Developing sampley to be a widely applicable tool
Sometime later, my postdoc supervisor Dan, in his casual, offhand way of suggesting things that he’s put considerable thought into, said “hey, you know, we should turn this into a package”. By this point, we had code for processing tracks and sightings in a variety of ways, which remains at the core of sampley’s functionality, but it was tailored to our dataset. Over time, and after consultation with other researchers (many thanks to them for their input!), we broadened the applicability so that it is now suitable for a variety of data types and formats.
Moreover, in the interest of being user-friendly, the package contains only a small number of functions organised into three stages with a straightforward series of steps. Finally, as the thought of Python may elicit discomfort from the many ecologists who are loyal to R, we have included extensive guidance and numerous exemplars so that the learning curve for those unfamiliar with Python is more of a gentle incline.
Uses of sampley
We believe that sampley will address the issues faced by researchers when processing visual survey data into samples: it can save time and effort, facilitate the trialling of multiple ways of data processing, and improve reproducibility. Moreover, as far as the computer is concerned, the lines are just lines and the dots just dots. So, although, in our original work, they represent vessel tracks and whale sightings, for others, they could represent just about anything that can take the form of a line or dot. For example, the lines could be paths that an observer walks along and the dots the birds that they see.
And so, if you find yourself in your own version of the not-so-idyllic scene, we encourage you to visit the sampley PyPI project page (https://pypi.org/project/sampley/) where you’ll find links to the user manual and numerous exemplars, as well as the package itself, and, hopefully, sampley will take some of the burden and let you get back to your idyllic scene, whatever it may be.
Read the full article here.

