Every species in the world has a unique geographic distribution. But many species have similar ranges. There are many things that can cause two (or more) species to have similar ranges – for example shared evolutionary histories, physical obstacles (mountains, oceans etc.) or ecological barriers limiting their dispersal. As a consequence, different regions of the globe are inhabited by different sets of living organisms.
In the mid-19th century ecologists recognised that the earth could be divided into different biogeographic regions. Alfred Russel Wallace (1823–1913) played a key role in defining and recognising biogeographic regions. He improved the existing maps of biogeographic regions and provided basic rules to identify them. His observation that some of these regions are home to similar species, despite being far away from each other and separated by significant barriers was the inspiration for Alfred Wegener’s theory of continental drift. In more recent years regionalisation has been used to understand the spatial drivers of biological evolution and to protect those regions characterised by particularly unique flora and fauna.
The biogeographic regions identified by Alfred Russel Wallace from The Geographical Distribution of Animals (1876)
This month’s issue contains two Applications articles and two Open Access articles, all of which are freely available.
– Plant-O-Matic: A free iOS application that combines the species distribution models with the location services built into a mobile device to provide users with a list of all plant species expected to occur in the 100 × 100 km geographic grid cell corresponding to the user’s location.
– RClone: An R package built upon genclone software which includes functions to handle clonal data sets, allowing:
Checking for data set reliability to discriminate multilocus genotypes (MLGs)
Ascertainment of MLG and semi-automatic determination of clonal lineages (MLL)
Genotypic richness and evenness indices calculation based on MLGs or MLLs
Describing several spatial components of clonality
Today, on International Owl Awareness Day (August 4), we celebrate the research we have done to better understand owls and their prey. There are over 200 extant species of owls, a handful of which have geographic distributions spanning several continents (i.e., barn owl, snowy owl, short-eared owl, long-eared owl). So no matter where you are in the world you’re probably not too far away from an owl.
Climate change and habitat fragmentation are interacting threats: it is likely that many species cannot reach newly suitable areas at the cool edge of their range because there is not enough habitat, in the right places, to support range expansion over multiple generations. Conservation efforts are already underway to restore large areas of habitat, and to improve the “connectivity” within networks of habitat. However, there are multiple ways of measuring connectivity and few of them address the scale of shifts that are likely to be needed under climate change. This could be a problem if it leads to inefficient conservation prioritisation.
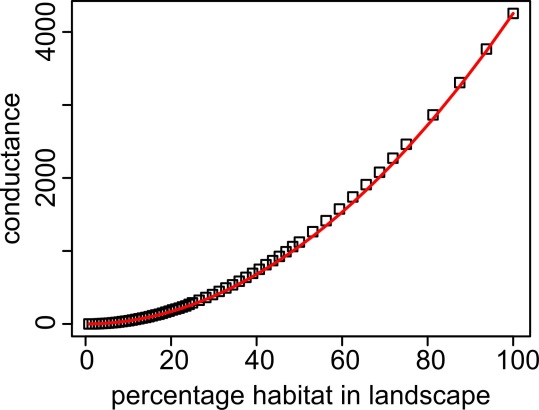
The Conductance Metric
How conductance generally depends on the amount of habitat in the landscape. Squares show the conductance of landscapes with a random selection of cells chosen to be habitat. The red line is based only on the 100% point and the expectation that conductance is proportional to amount of habitat squared.
We first developed the conductance metric in 2012 and we found that it is correlated to the speed with which a species can spread through a landscape, from a specified source location to a specified target. A key difference between this and most other connectivity metrics is that it incorporates both reproduction within habitat patches and dispersal between habitat patches, over multiple generations (further explanation here). Sometimes there could be many very well-connected patches in a network, and yet no easy way for a species to cross the landscape from end to end. This could be a problem for the species’ survival, if staying within its current regions of occupancy is unsustainable, for example if it is being pushed northwards by climate change. Continue reading “Planning Habitat for Very Long-Distance Connectivity under Climate Change”
Earlier this month Leila Walker attended a panel discussion imparting ‘Practical Tips for Reproducible Research’, as part of the Annual Meeting of the Macroecology Special Interest Group(for an overview of the meeting as a whole check out this Storify). The session and subsequent drinks reception was sponsored by Methods in Ecology and Evolution. Here, Leila reports back on the advice offered by the panel members.
For anyone interested in viewing further resources from the session, please see here. Also, you may like to consider attending the best practice for code archiving workshop at the 2016 BES Annual Meeting. Do you have any tips for making your research reproducible? Comment on this post or email us and let us know!
This year’s Annual Meeting of the Macroecology SIG was the biggest yet, with around 75 attendees and even representation across the PhD, post-doc and faculty spectrum. The panel discussion aimed to consider what reproducibility means to different people, identify the reproducibility issues people struggle with, and ultimately provide practical tips and tools for how to achieve reproducible research. Each of the participants delivered a short piece offering their perspective on reproducibility, with plenty of opportunity for discussion during the session itself and in the poster and wine reception that followed.
Attendees enjoy a wine reception (sponsored by MEE) whilst viewing posters and reflecting on the Reproducible Research panel discussion. Photo credit: Leila Walker
The paper, which is freely available, describes the package and the data it wraps in detail. Rather than rehash the information here, we will use this post to briefly introduce the goals of the package and thank some of the people that helped it come to be.
What Data Does Open Tree Have and How Can rotl Help You Get It?
The Open Tree of Life combines knowledge from thousands of scientific studies to produce a single source of information about the relationships among all species on earth. In addition to storing the trees and taxonomies that go into this project, the Open Tree provides a “synthesis tree” that represents this combined knowledge. The Open Tree data can be accessed via the web page linked above, and through an API. rotl takes advantage of this API to give R users the ability to search for phylogenetic information and import the results into their R sessions. The imported data can then be used with the growing ecosystem of packages for phylogenetic and comparative biology in R. Continue reading “rotl Paper Published”
High-throughput genomic methods are increasingly used to investigate invertebrate thermal responses with greater dimensionality and resolution than previously achieved. However, corresponding methods for characterising invertebrate phenotypes are still lacking. Jacinta Kong and her co-authors propose a novel use of thermocyclers as temperature-controlled incubators for characterising invertebrate phenotypes. Why use a thermocycler instead of current methods to characterise thermal phenotypes? In this video they outline key advantages of … Continue reading Why You Should Use a Thermocycler Instead of an Incubator
In the US, July is National Bison Month but most people in Europe are totally oblivious to it. I wasn’t even aware of it before being asked to write this blog post in connection with our recent Methods in Ecology and Evolution paper about quantifying population sizes of large herbivores. Some will argue that it is because we don’t ‘do’ day, month, state or national animals on this side of the Atlantic as much as the Americans do.
But another reason is that the European bison, Bison bonasus bonasus, is simply not sufficiently well-known or associated with European nature in the public’s mind. This is particularly true in Western Europe where this species has been extinct since medieval times.
Early European accounts from North America reported huge bison populations – with estimates of up to 60 million – moving to and fro in the great bison belt. These past migratory movements across the Great Plains are familiar well beyond the US and feed our view of untamed wilderness prior to the impact of European ’civilisation’. In contrast, there are hardly any records of European bison numbers until just before the last wild one was reported killed in Poland in 1921. Continue reading “European Bison, Rewilding and Dung Fungal Spore”