Issue 9.1: Qualitative Methods for Eliciting Judgements for Decision Making

Issue 9.1 is now online!

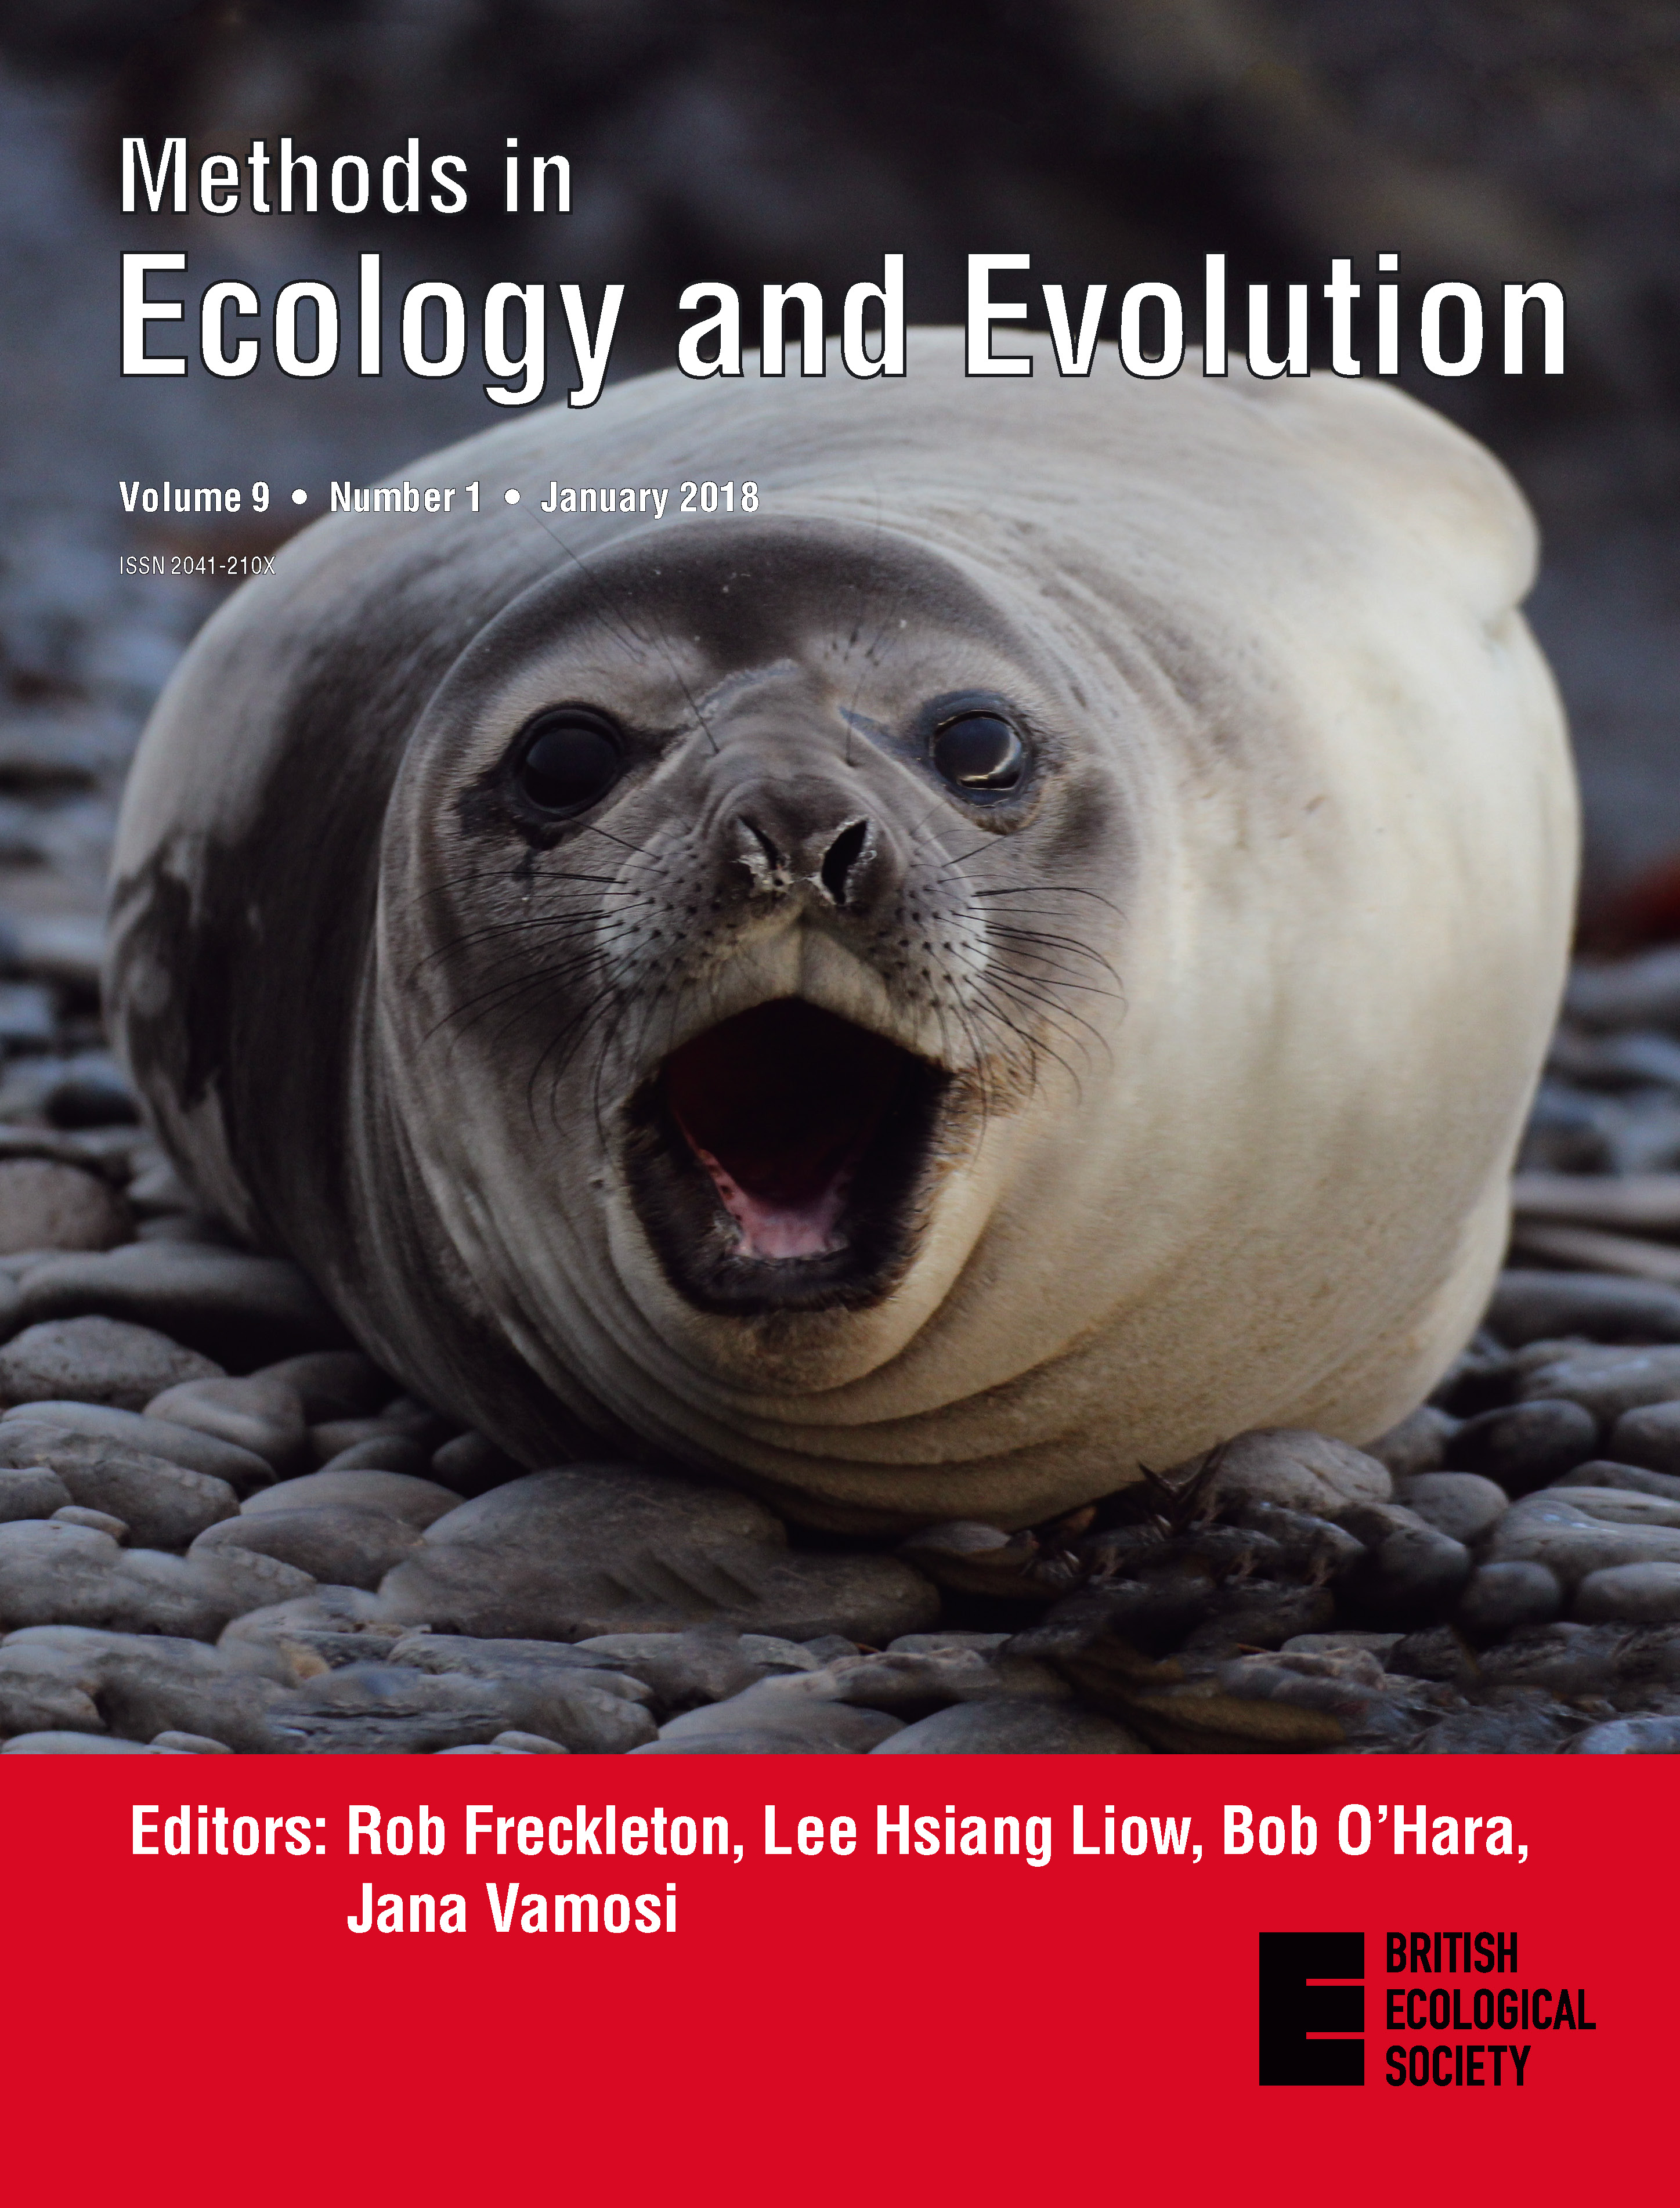
Our first issue of 2018, which includes our latest Special Feature – “Qualitative methods for eliciting judgements for decision making” – is now online!

This new Special Feature is a collection of five articles (plus an Editorial from Guest Editors Bill Sutherland, Lynn Dicks, Mark Everard and Davide Geneletti) brings together authors from a range of disciplines (including ecology, human geography, political science, land economy and management) to examine a set of qualitative techniques used in conservation research. They highlight a worrying extent of poor justification and inadequate reporting of qualitative methods in the conservation literature.

As stated by the Guest Editors in their Editorial “these articles constitute a useful resource to facilitate selection and use of some common qualitative methods in conservation science. They provide a guide for inter-disciplinary researchers to gauge the suitability of each technique to their research questions, and serve as a series of checklists for journal editors and reviewers to determine appropriate reporting.”

All of the articles in the ‘Qualitative methods for eliciting judgements for decision making‘  Special Feature are all freely available.
Continue reading “Issue 9.1: Qualitative Methods for Eliciting Judgements for Decision Making”

Satellite Data Fusion for Ecologists and Conservation Scientists

What is satellite data fusion, and how can it benefit ecologists and conservation scientists? In a new Methods in Ecology and Evolution video, Henrike Schulte-to-Bühne answers this question using whiteboards and questionable drawing skills. The availability and accessibility of multispectral and radar satellite remote sensing (SRS) imagery are at an unprecedented high. However, despite the benefits of combining multispectral and radar SRS data, data fusion techniques, including image … Continue reading Satellite Data Fusion for Ecologists and Conservation Scientists

How Can We Quantify the Strength of Migratory Connectivity?

Technological advancements in the past 20 years or so have spurred rapid growth in the study of migratory connectivity (the linkage of individuals and populations between seasons of the annual cycle). A new article in Methods in Ecology and Evolution provides methods to help make quantitative comparisons of migratory connectivity across studies, data types, and taxa to better understand the causes and consequences of the seasonal distributions … Continue reading How Can We Quantify the Strength of Migratory Connectivity?

Sticking Together or Drifting Apart? Quantifying the Strength of Migratory Connectivity

Post provided by Emily Cohen

Red Knot migratory connectivity is studied with tracking technologies and color band resighting. © Tim Romano
Red Knot migratory connectivity is studied with tracking technologies and colour band resighting. © Tim Romano

The seasonal long-distance migration of all kinds of animals – from whales to dragonflies to amphibians to birds – is as astonishing a feat as it is mysterious and this is an especially exciting time to study migratory animals. In the past 20 years, rapidly advancing technologies  – from tracking devices, to stable isotopes in tissues, to genomics and analytical techniques for the analysis of ring re-encounter databases – mean that it’s now possible to follow many animals throughout the year and solve many of the mysteries of migration.

What is Migratory Connectivity?

One of the many important things we’re now able to measure is migratory connectivity, the connections of migratory individuals and populations between seasons. There are really two components of migratory connectivity:

  1. Linking the geography of where individuals and populations occur between seasons.
  2. The extent, or strength, of co-occurrence of individuals and populations between seasons.

Continue reading “Sticking Together or Drifting Apart? Quantifying the Strength of Migratory Connectivity”

Issue 8.11

Issue 8.11 is now online!

The November issue of Methods is now online!

This extra large issue contains seven Applications articles and three Open Access articles. These five papers are freely available to everyone, no subscription required.

 LSCorridors: LandScape Corridors considers stochastic variation, species perception and landscape influence on organisms in the design of ecological corridors. It lets you simulate corridors for species with different requirements and considers that species perceive the surrounding landscape in different ways.

 HistMapR: HistMapR contains a number of functions that can be used to semi-automatically digitize historical land use according to a map’s colours. Digitization is fast, and agreement with manually digitized maps of around 80–90% meets common targets for image classification. This manuscript has a companion video and was recommended by Associate Editor Sarah Goslee.

 vortexR: An R package to automate the analysis and visualisation of outputs from the population viability modelling software Vortex. vortexR facilitates collating Vortex output files, data visualisation and basic analyses (e.g. pairwise comparisons of scenarios), as well as providing more advanced statistics.

Continue reading “Issue 8.11”

Issue 8.8

Issue 8.10 is now online!

The October issue of Methods is now online!

This double-sized issue contains three Applications articles and two Open Access articles. These five papers are freely available to everyone, no subscription required.

 Phylogenetic TreesThe fields of phylogenetic tree and network inference have advanced independently, with only a few attempts to bridge them. Schliep et al. provide a framework, implemented in R, to transfer information between trees and networks.

 Emon: Studies, surveys and monitoring are often costly, so small investments in preliminary data collection and systematic planning of these activities can help to make best use of resources. To meet recognised needs for accessible tools to plan some aspects of studies, surveys and monitoring, Barry et al. developed the R package emon, which includes routines for study design through power analysis and feature detection.

 Haplostrips: A tool to visualise polymorphisms of a given region of the genome in the form of independently clustered and sorted haplotypes. Haplostrips is a command-line tool written in Python and R, that uses variant call format files as input and generates a heatmap view.

Continue reading “Issue 8.8”

Imperfect Pathogen Detection: What to Do When Sampling and Diagnostic Tests Produce Inaccurate Results

Post Provided by Graziella DiRenzo

A salamander having its skin swabbed to test for Bsal infection.

Imagine you’re at the doctor’s office. You’re waiting to hear back on a critical test result. With recent emerging infectious diseases in human populations, you are worried you may be infected after a sampling trip to a remote field site. The doctor walks in. You sit nervously, sensing a slight tremble in your left leg. The doctor confidently declares, “Well, your tests results came back negative.” In that moment, you let out a sigh of relief, the kind you feel throughout your body. Then, thoughts start flooding your mind. You wonder– what are the rates of false negatives associated with the test? How sensitive is the diagnostic test to low levels of infection? The doctor didn’t sample all of your blood, so how can they be sure I’m not infected? Is the doctor’s conclusion right?

 Now, let’s say I’m the doctor and my patient is an amphibian. I don’t have an office where the amphibian can come in and listen to me explain the diagnosis or the progression of disease − BUT I do regularly test amphibians in the wild for a fatal fungal pathogen, known as Batrachochytrium dendrobatidis (commonly known as Bd). Diseases like Bd are among the leading causes of the approximately one-third of amphibian species that are threatened, near threatened, or vulnerable to extinction. To test for Bd, and the recently emerged sister taxon Batrachochytrium salamandrivorans (hereafter referred to as: Bsal), disease ecologists rely on non-invasive skin swabs. Continue reading “Imperfect Pathogen Detection: What to Do When Sampling and Diagnostic Tests Produce Inaccurate Results”

Multi-State Species Distribution Models: What to do When Species Need Multiple Habitats

Post provided by Jan Engler, Veronica Frans and Amélie Augé

The north, south, east, and west boundaries of a species’ range tell us very little about what is happening inside…

― Robert H. MacArthur (1972, p. 149)

When You Enter the Matrix, Things Become Difficult!

New Zealand sea lion mother and pup. © Amélie Augé

Protecting wildlife calls for a profound understanding of species’ habitat demands to guide concrete conservation actions. Quantifying the relationships between species and their environment using species distribution models (SDMs) has attracted tremendous attention over the past two decades. Usually these species-environment relationships are estimated on coarse spatial scales, using globally-interpolated long-term climate data sets. While they’re useful for studies on large-scale species distributions, these environmental predictors have limited applications for conservation management.

Climatic data were the first environmental information available with global coverage, but a wide range of Earth observation techniques have increased the availability of much finer environmental information. This allows us to quantify species-environment relationships in unprecedented detail. We can now shift the scale that SDMs operate at, resulting in more useful applications in conservation – SDMs now enter the matrix.

This shift in scale brings new challenges, especially for species using multiple distinct habitat types to survive. The landscape matrix, which has been negligible at the broad (global) scale, is hugely important at the fine (local) scale. It is not only that we need to quantify certain habitat types but also need to consider their arrangement in the landscape, which is basically what the landscape matrix is about. But as we enter the matrix, things become difficult. Continue reading “Multi-State Species Distribution Models: What to do When Species Need Multiple Habitats”

Protecting Habitat Connectivity for Endangered Vultures: Identifying Priorities with Network Analysis

Post provided by Juliana Pereira, Santiago Saura and Ferenc Jordán

The endangered Egyptian vulture. ©Carlos Delgado

One of the main causes behind biodiversity loss is the reduction and fragmentation of natural habitats. The conversion of natural areas into agricultural, urban or other human-modified landscapes often leaves wild species confined to small and isolated areas of habitat, which can only support small local populations. The problem with small, isolated populations is that they are highly vulnerable to extinction caused by chance events (such as an epidemic or a natural disaster in the area), or by genetic erosion (dramatic loss of genetic diversity that weakens species and takes away their ability to adapt to new conditions).

On top of that, we now have the added concern of climate change, which is altering environmental conditions and shifting habitats to different latitudes and altitudes. To survive in the face of these changes, many species need to modify their geographical distribution and reach new areas with suitable conditions. The combination of mobility (a biological property of species) and the possibility of spatial movement (a physical property of the landscape) is critically important for this. Continue reading “Protecting Habitat Connectivity for Endangered Vultures: Identifying Priorities with Network Analysis”

Mark-Recapture and Metapopulation Structure: Using Study Design to Minimize Heterogeneity

Post provided by Delphine Chabanne

Pod of bottlenose dolphins observed in Cockburn Sound, Perth, Western Australia.

Wildlife isn’t usually uniformly or randomly distributed across land- or sea-scapes. It’s typically distributed across a series of subpopulations (or communities). The subpopulations combined constitute a metapopulation. Identifying the size, demography and connectivity between the subpopulations gives us information that is vital to local-species conservation efforts.

What is a Metapopulation?

Richard Levins developed the concept of a metapopulation to describe “a population of populations”. More specifically, the term metapopulation has been used to describe a spatially structured population that persists over time as a set of local populations (or subpopulations; or communities).  Emigration and immigration between subpopulations can happen permanently (through additions or subtractions) or temporarily (through the short-term presence or absence of individuals).

How individuals could distribute themselves within an area.

Continue reading “Mark-Recapture and Metapopulation Structure: Using Study Design to Minimize Heterogeneity”