In demography, a set of processes (survival, growth, fecundity, etc.) interacts to produce observable patterns (population size, structure, growth rate, etc.) that change over time. With traditional approaches you follow the individuals of a population over some timespan and track all of these processes.
Demographic patterns and processes (Click to expand)
However, depending on the organism, some processes may be very hard to quantify (e.g. mortality or recruitment in animals or plants with long lifespans). You may have observed the patterns for the organism that you’re studying and, even better, measured some, but not all, of the processes. The question is: can we use this limited information to estimate the processes we couldn’t measure?Continue reading “Inverse Modelling and IPMs: Estimating Processes from Incomplete Information”
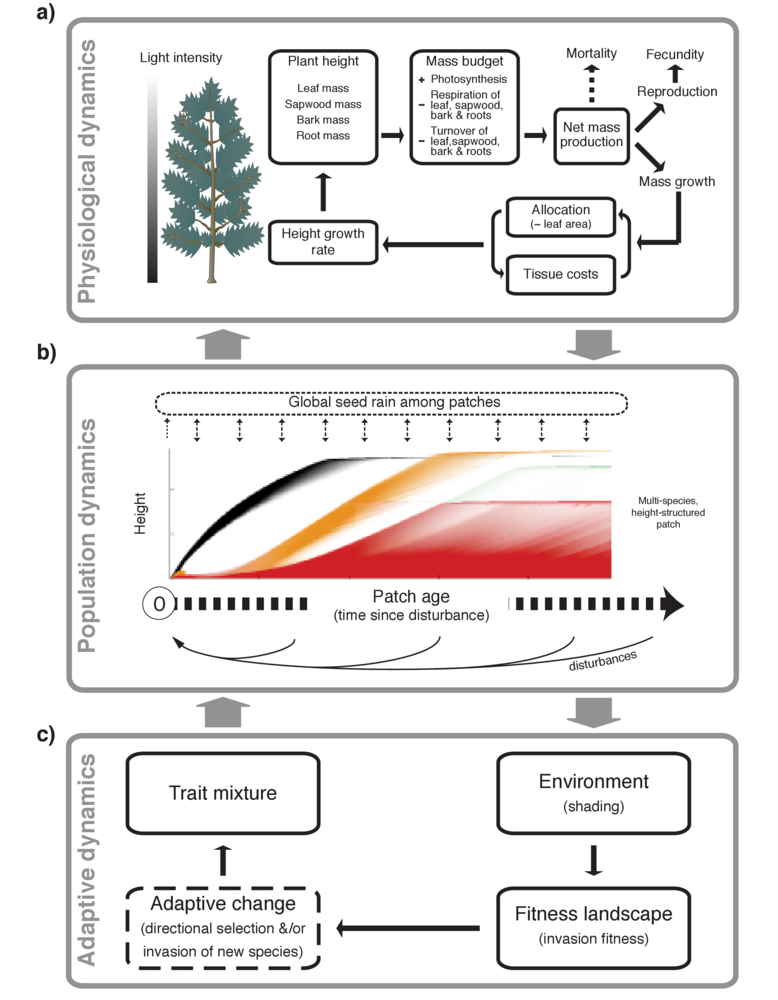
Our paper in Methods in Ecology and Evolution describes a new software package, plant. plant is an individual-based simulation model that simulates the growth of individual trees, stands of competing plants, or entire metacommunities under a disturbance regime, using common physiological rules and trait-based functional trade-offs to capture differences among species.
Non-Linear Processes and Thousands of Plants
Since the development of gap models in the 1970s (e.g. Botkin 1972), researchers have been using computer simulations to investigate how elements of plant biology interact with competition and disturbance regimes to influence vegetation demography, structure and diversity. Simulating the competitive interactions among many thousands of plants, however, is no easy task.
Despite widespread recognition of the importance of key non-linear processes — such as size-structured competition, disturbance, and trait-based trade-offs — for vegetation dynamics, relatively few researchers have been brave (or daft) enough to try and incorporate such processes into their models. The situation is most extreme in theoretical ecology, where much contemporary theory (e.g. coexistence theory, neutral theory) is still built around completely unstructured populations.
Features of plant
Key processes modelled within the plant package.
The plant package attempts to change that by providing an extensible, open source framework for studying trait-, size- and patch-structured dynamics. One thing that makes the plant model significant is the focus on traits. plant is one of several attempts seeking to integrate current understanding about trait based trade-offs into a model of individual plant function (see also Moorcroft et al 2001, Sakschewski et al 2015).
A second feature that makes the plant software significant, is it that is perhaps the first example where a computationally intensive model has been packaged up in a way that enables widespread usage, makes the model more usable and doesn’t sacrifice speed.
One of my main areas of study is Periphyton developed in microcosms. For those of you who don’t know, Periphyton is a green biofilm that you may notice in some (not very clean) swimming pools and is composed mainly of algae, bacteria, fungi, meiofauna and detritus. I started studying Periphyton because my Masters thesis involved developing a model in freshwater systems and after that I wanted to look into their spatial distribution.
I wanted to find an opportunity to connect my study system with two of my passions: space travel (I used to watch Star Trek and also I thoroughly enjoyed Space: The Final Frontier for Ecological Theory by Peter Kareiva) and tropical rainforests (which I developed a fondness for while watching Tarzan). I thought I could use Periphyton as a model system to test ecological theory, with a complexity similar to tropical forest as suggested by Lowe [1].
The study of the spatial structure of Periphyton was not as easy as space travel in Star Trek (for one thing they have a warp drive and I don’t!). I wanted to compare spatial models and data, but the methods that were available weren’t very well-suited to what I wanted to do, so I was not sure of how to begin. In the end, I decided to launch my first microcosms experiment and in the first photos I took of Periphyton’s spatial structure I saw they were like clouds, algae clouds. Continue reading “From Star Trek to Species Ranks in Space… and Beyond”
Damselflies marked in the field, which will hopefully be recaptured later. This small insect at our field site had only about 10% recapture probability.
The quantification of survival selection in the field has a long history in evolutionary biology. A considerable milestone in this field was the highly influential publication by Russel Lande and Steve Arnold in the early 1980s.
The practical implementation of Lande and Arnold’s method involved simply fitting a linear model with standardized response (survival) and explanatory (trait) variables values with quadratic terms (multiplied by two). This straightforward method allowed evolutionary biologists to measure selection coefficients using commonly available statistical software and these estimates could be used directly within a quantitative genetic framework. Continue reading “Measuring Survival Selection in Natural Populations: How important is recapture probability?”
Our final issue of 2015 contains one Applications article and two Open Access articles, all of which are freely available.
– stagePOP: A tool for predicting the deterministic dynamics and interactions of stage-structured populations (i.e. where the life cycle consists of distinct stages, for example eggs, juveniles and reproductive adults). The continuous-time formulation enables stagePop to easily simulate time-varying stage durations, overlapping generations and density-dependent vital rates.
Julia Cherry et al. provide one of this month’s Open Access articles. In ‘Testing sea-level rise impacts in tidal wetlands: a novel in situ approach‘ the authors describe the use of experimental weirs that manipulate water levels to test sea-level rise impacts in situ and at larger spatial scales. This new method can provide more robust estimates of sea-level rise impacts on tidal wetland processes. This article was accompanied by a press release when it was published in Early View. You can read more about this article here.
Biodiversity Indicators are some of the most important tools linking ecological data with government policy. Indicators need to summarise large amounts of information in a format that is accessible to politicians and the general public. The primary use of indicators is to monitor progress towards environmental targets. For the UK, a suite of indicators are produced annually which are used to monitor progress towards the Aichi targets of the Convention on Biological Diversity as well as for European Union based commitments. However, this is complicated by the fact that biodiversity policy within the UK is devolved to each of the four nations, so additional indicators have been developed to monitor the commitments of each country.
A range of biodiversity indicators exist within this suite covering the five strategic goals of the Convention; which include addressing the causes of biodiversity loss, reducing pressures on biodiversity and improving status of biodiversity within the UK. Within strategic goal C (improve status of biodiversity by safeguarding ecosystems, species and genetic diversity) there are currently 11 “State” indicators that use species data to monitor progress towards the targets underlying this goal. Most existing species based indicators use abundance data from large scale monitoring schemes with systematic protocols. However, there are other sources of data, such as occurrence records, that can offer an alternative if they are analysed using the appropriate methods. This post will discuss the development of species indicators for occurrence records to complement the current UK species based indicators, specifically relating to the C4b priority species indicator and the D1c pollinators indicator. Continue reading “Building a Better Indicator”
If you’re anything like me, you might experience a minor existential crisis weekly. As scientists we question the world around us and, for me, this questioning turns all-too-often inwards to my career. I don’t think that’s unusual: ask any scientist about their ‘Plan B’, and the extent to which it’s thought through is often astonishing (if a café-cum-cocktail bar ever opens in Glasgow’s West End, which specialises in drinks that employ spice blends from around the world and are named after old spice trade routes and trading vessels, then you know I’ve jumped the science ship).
Contributing open-source software is something which has made my work feel a bit more relevant and helped me feel a bit less of an imposter. I’ll explain why that is, give some tips to beginners for building a first R package, and hopefully persuade other (especially early-career) researchers to do the same. Continue reading “A Quickstart Guide for Building Your First R Package”
This month’s issue contains two Applications articles and one Open Access article, all of which are freely available.
– mvMORPH: A package of multivariate phylogenetic comparative methods for the R statistical environment which allows fitting a range of multivariate evolutionary models under a maximum-likelihood criterion. Its use can be extended to any biological data set with one or multiple covarying continuous traits.
– Low-cost soil CO2 efflux and point concentration sensing systems: The authors use commercially available, low-cost and low-power non-dispersive infrared (NDIR) CO2 sensors to develop a soil CO2 efflux system and a point CO2 concentration system. Their methods enable terrestrial ecologists to substantially improve the characterization of CO2 fluxes and concentrations in heterogeneous environments.
This month’s Open Access article comes from Jolyon Troscianko and Martin Stevens. In ‘Image calibration and analysis toolbox – a free software suite for objectively measuring reflectance, colour and pattern‘ they introduce a toolbox that can convert images to correspond to the visual system (cone-catch values) of a wide range of animals, enabling human and non-human visual systems to be modelled. The toolbox is freely available as an addition to the open source ImageJ software and will considerably enhance the appropriate use of digital cameras across multiple areas of biology. In particular, researchers aiming to quantify animal and plant visual signals will find this useful. This article received some media attention upon Early View publication over the summer. You can read the Press Release about it here.
Today is 10th National Wildlife Day. As we have done for a few awareness days this year (Bats, Biodiversity and Bees so far) we are marking the day by highlighting some of our favourite Methodsin Ecology and Evolution articles on the subject. Obviously ‘wildlife’ is a pretty big topic, so we have narrowed our focus (slightly) to monitoring wildlife (with one or two additional papers that we didn’t want to leave out).
This list is certainly not exhaustive and there are many more wonderful articles on these topics in the journal. You can see more of them on the Wiley Online Library.
If you would like to learn more about National Wildlife Day, you may wish to visit the organisation’s website, follow them on Twitter and Facebook or check out today’s hashtag: #NationalWildlifeDay.
Without further ado though, please enjoy our selection of Methods articles for National Wildlife Day:
Integrating Demographic Data
Our National Wildlife Day celebration begins with an article from our EURING Special Feature. Robert Robinson et al. present an approach which allows important demographic parameters to be identified, even if they are not measured directly, in ‘Integrating demographic data: towards a framework for monitoring wildlife populations at large spatial scales‘. Using their approach they were able to retrieve known demographic signals both within and across species and identify the demographic causes of population decline in Song Thrush and Lawping.
This month’s issue contains two Applications article and one Open Access article, all of which are freely available.
– LEA: This R package enables users to run ecological association studies from the R command line. It can perform analyses of population structure and genome scans for adaptive alleles from large genomic data sets. The package derives advantages from R programming functionalities to adjust significance values for multiple testing issues and to visualize results.
–PIPITS: An open-source stand-alone suite of software for automated processing of Illumina MiSeq sequences for fungal community analysis. PIPITS exploits a number of state of the art applications to process paired-end reads from quality filtering to producing OTU abundance tables.
Giovanni Strona and Joseph Veech provide this month’s Open Access article. Many studies have focused on nestedness, a pattern reflecting the tendency of network nodes to share interaction partners, as a method of measuring the structure of ecological networks. In ‘A new measure of ecological network structure based on node overlap and segregation‘ the authors introduce a new statistical procedure to measure both this kind of structure and the opposite one (i.e. species’ tendency against sharing interacting partners).