A Beginner’s Guide to Data Exploration and Visualisation with R
by Elena N. Ieno and Alain F. Zuur
 In 2010 Alain Zuur, Elena Ieno and Chris Elphick published a paper in Methods in Ecology and Evolution entitled ‘A protocol for data exploration to avoid common statistical problems‘ (Volume 1, Issue 1). Little did they know at the time that this paper would become one of the journal’s all-time top downloaded and top cited papers, with a total of 22,472 downloads between 2010 and 2014.
Based on this success they decided to extend the material in the paper into a book.
Zuur and his colleagues at Highland Statistics ltd. give about 25 five-day statistics courses per year. Their typical audience consists of biological scientists at the post-graduate and post-doctoral levels. Early on in each course they have the following conversation with the participants:
Speaker: “Do you review submitted manuscripts for journals?”
Audience: “Yes.”
Speaker: “Do you like the statistical part of these manuscripts?”
Audience: “No!”
Speaker: “Do you understand the statistical part?”
Audience: “Not always.”
What if there were ways you could make reviewing your paper easier and more enjoyable for reviewers? What if making your manuscript easier to understand and nicer to read would increase the likelihood of your work being published?
A Beginner’s Guide to Data Exploration and Visualisation with R explains how you can do exactly that! Alain Zuur and Elena Ieno use ecological datasets to discuss the data exploration and visualisation tools you can use to make your paper simpler for readers and reviewers to understand. The authors also explain how to visualise the results of statistical models, an important aspect of scientific papers.
No one likes tables with numbers, especially not if they contain interactions. Corrections of interactions and slopes will confuse even the experienced statistician! A graph summarising the results of your statistical model makes it so much easier for a referee to understand what you have done and what the results tell you! The Visualisation of your data is incredibly important (which is why it is part of the book’s title).
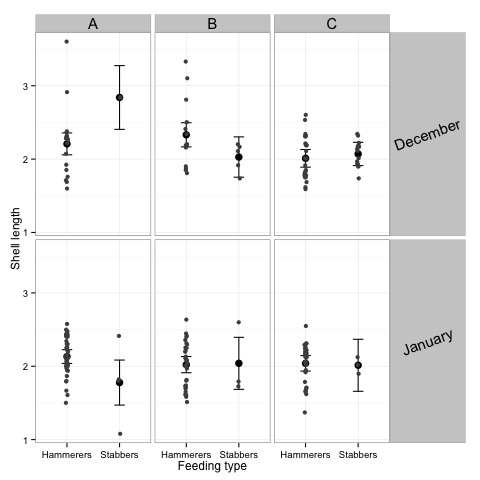 Data Exploration is where you try to understand your own data (outliers, collinearity, types of relationships etc.) and whether the quality of the data is good enough to answer your biological questions. There is an example in the book where shell length eaten by oystercatchers is modelled as a function of season, location, and feeding type. This three-way interaction is highly significant but a simple graph of the results shows that in one specific combination of covariates (location A, stabbers, December) there are only two shell length observations, and these also have the same value and are relatively large. No wonder that the three-way interaction is significant! Perhaps we should conclude that the quality of the data is not good enough for such a model.
The book includes the R code needed to construct, visualise, and explore the main features of the example datasets step by step. It is written in such a way that it can be helpful for people with even a small amount of statistical knowledge. A knowledge of linear regression is all that you need to get started.
You can order your copy of A Beginner’s Guide to Data Exploration and Visualisation with R from http://www.highstat.com/BGDEV.htm (Paperback £29, eBook £20)
 A Beginner’s Guide to Data Exploration and Visualisation with R is the fourth book in Highland Statistics’ Beginner’s Guide to series. Previous books include A Beginner’s Guide to Generalized Additive Models with R, A Beginner’s Guide to GLM and GLMM with R, and A Beginner’s Guide to GAMM with R. All of these titles are available exclusively from www.highstat.com
You can read the original paper, free of charge, HERE.
