Post provided by Martha Ellis and Jody Tucker

The seemingly basic question of whether a population is increasing, decreasing, or stable can be one of the most difficult to answer. Collecting data on rare and elusive species is hard. Imagine trying to detect a handful of fisher or wolverine across hundreds of thousands of acres – it is physically demanding, time consuming and logistically complicated. And that’s just to do it once! To monitor a population for changes, you have to repeat these surveys regularly over many years. The long-term monitoring that is necessary for conservation requires careful planning and a substantial commitment of resources and funding. So before we spend these valuable resources, it’s critical to know whether the data we are collecting can help us to answer our questions.

The Power of Power Analyses
Power analyses are an essential part of planning a monitoring program. They tell us if our sampling design and sample size has the statistical power required to detect change in the population. Traditionally, power analyses have been in the realm of statisticians and not very accessible for the average biologist or ecological manager trying to run a monitoring program. Ecological data are typically “messy” and require burly statistical models to deal with their complexity. We also often have to rely on surrogate measures to track data that are too costly or inaccessible to measure directly, so we have to move beyond the traditional ‘black box’ of analytical power assessments.

To try and address common issues in monitoring design, we developed the R package rSPACE (Spatially-explicit Power Analyses in Conservation and Ecology). This package provides a basic ‘go to’ for setting up a power analysis specific to a landscape, species and sampling design. Our approach differs from traditional power analyses in that we:
- Base the analysis on information about habitat and species biology instead of model parameters (see table 1,left)
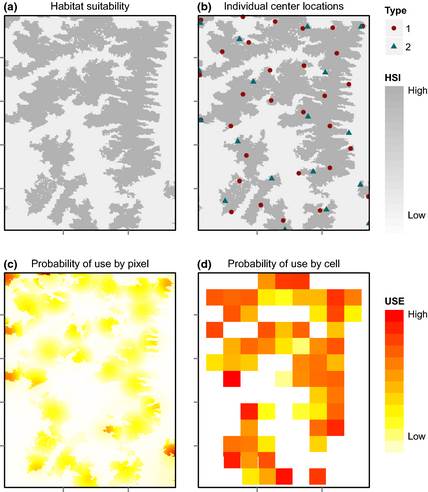
- Use raster habitat data to provide a specific location as a basis for the analysis (see figure 1, below)
-

Steps to building a simulated encounter history. Figure 1 from ‘rSPACE‘ by Ellis et al. Focus on the ability to detect changes in the underlying value of interest: the population size or abundance.
This last aspect is particularly important because monitoring project leaders are often faced with the budgetary or logistic constraints that limit monitoring to presence/absence data only. We designed our program to evaluate power to detect change in occupancy (presence/absence of a species across a landscape) even though we’re most interested in change in the population size.
Practice Makes Perfect
Until you have real data to work with, rSPACE provides a tool to simulate data that you can practice on. Simulating data is actually a much more informative process than you might think. It makes you think through exactly what your future data will look like and why.
To simulate data for a monitoring program, you have to think carefully about what you really expect to be happening with your population over time. How are the individuals in the population scattered on the landscape? How do individuals interact? How fast is the population changing? How exactly does that population change occur? How big of a change in the population do you need to be able to detect? Explicitly addressing those questions, and having to estimate what numbers you need to represent them, is the first step toward dealing with real life data (and any issues you’re likely to stumble upon once you get it).

The next natural step is to start thinking about what you should DO with that data. It’s easy to get so focused on all the challenges of getting the data, that the question of “what to do once you have them” gets glossed over surprisingly frequently. It’s hard to read a methodological paper in statistics and immediately understand its implications for real world, messy datasets. We need a chance to play around with it first. Simulated data lets us anticipate problems and work through methodological issues in advance of conducting expensive work and peeking at what our results might be. Any statistician you meet will give you a big hug for planning out your analysis before you start asking their advice on how to salvage your real data!
Dealing With “What-If”
Ideally, every experimental design would have thorough and fully tailored statistical evaluation for every situation to make sure that it is perfectly suited for the questions being asked. But, who are we kidding? We do the best we can and we figure out how to deal with problems as they come up.
rSPACE provides a means to anticipate what problems are likely to arise and a tool to help keep the analysis side of a monitoring program at the forefront of the planning process. The goal with rSPACE is to make the objectives and assumptions underlying a monitoring plan as clear as possible. By doing so, we hope to allow researchers to start asking the following sorts of ‘what-ifs’ early on in their plans:
- What if there are blizzards/fires/budget cuts and I can’t get to all my scheduled sites that year?
- What if my population is not increasing or declining as fast as I thought it was?
- What if I can’t detect my species as well as I thought I could?
For each “what-if” scenario, rSPACE allows you to estimate the sample size or sampling effort needed to detect a specific population change or – if you have a set sample size in mind – the statistical power of your design. Finally, with so many monitoring plans relying on occupancy as a surrogate for population sizes, rSPACE provides an objective means to explore the relationship between occupancy and population size for your particular landscape.
A Work in Progress…
Just as with monitoring projects, we couldn’t have anticipated all of the ramifications of the rSPACE project when we got started. We originally designed our framework for working with wolverine monitoring efforts in the Northern US Rockies, but quickly realized that we could adapt our program flow to work for many, many different species and situations.
We are actively using rSPACE to evaluate monitoring plans for lynx in Colorado (find out more about monitoring Canada lynx in ‘On the Tail of Reintroduced Canada Lynx‘), white-headed woodpecker monitoring in the US Pacific Northwest and fisher and marten in the Sierra Nevada Mountains among others. Every project we’ve worked on has led to new aspects and features to the code that we’ve provided, and we’re excited to keep adding to the project. All of our code is available online, and we are constantly aiming to improve the accessibility and applicability of the rSPACE package.
Monitoring wild populations is no easy task, especially since wildlife do not recognize the arbitrary political and property divides that are so often a factor in research and conservation. Realistically, our ability to monitor wildlife is only going to improve as we are better able to coordinate and collaborate monitoring efforts across jurisdictions and at large scales. However, in order for that to work we need common ground to objectively evaluate possible approaches and ensure the feasibility of our efforts. Rather than reinventing the wheel each time, our hope is that we and others can jump ahead a few steps by collaborating to build an approach that will make power analyses for monitoring an easily achievable goal.
To find out more about rSPACE, read our Methods in Ecology and Evolution article ‘rSPACE: Spatially based power analysis for conservation and ecology’.
This article is part of our Virtual Issue on Conservation Ecology. All articles in this Virtual Issue are freely available for a limited time.
