Post provided by HÉLÈNE MORLON
Yesterday saw the start of this year’s annual Evolution meeting and to celebrate Hélène Morlon has written a blog post discussing the amazingly versatile RPANDA package that she is developing with her research group. A description of RPANDA was published in the journal earlier this year and, like all our Applications papers, is freely available to read in full.
If you are attending Evolution, as well as attending the fabulous talks mentioned by Hélène below, do stop by booth 125 to see our BES colleague Simon Hoggart. Simon is the Assistant Editor of Journal of Animal Ecology and would be happy to answer your questions about any of our journals or any of the other work we do here at the BES.
RPANDA: a time machine for evolutionary biologists
Imagine “Doc”, Marty’s friend in Back to the Future, trying to travel back millions of years in an attempt to understand the history of life. Instead of building a time machine from a DeLorean sports car powered by plutonium, he could dig fossils, or more likely, he would use molecular phylogenies.
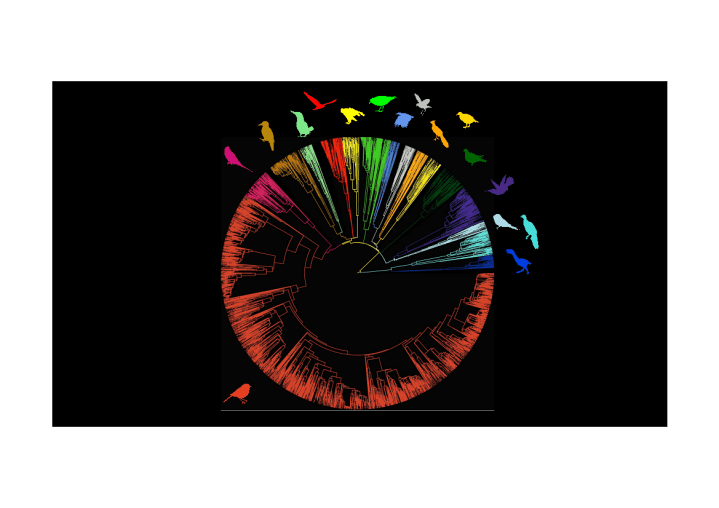
Molecular phylogenies are family trees of species that can be built from data collected today: the genes (molecules) of present-day species (Fig 1). They are often thought of as trees, in reference to Darwin’s tree of life. The leaves represent the present: species that can be found on Earth today. The branches represent the past: ancestral species, which from time to time split, giving rise to two independent species. The structure of the tree tells us which species descend from which ancestors, and when their divergence happened.
At Evolution this year, once again, we can expect that molecular phylogenies are going to be everywhere, in talks as well as informal discussions. For species groups that did not leave a lot of fossil specimens, molecular phylogenies are our only window into their past. Yet molecular phylogenies are not that easy to interpret: phylogenetic trees constructed from present day species are missing all the dead branches and leaves that did not leave any descendants in the present. Phylogenetic trees are full of holes, and we need mathematics and models in order to fill these holes and understand the history of life. This is why we can also expect that Evolution is also going to be full of discussions around phylogenetic comparative methods, those approaches that allow us to test a series of fascinating hypotheses about evolution using the incomplete record of the history of life provided by molecular phylogenies.
The development of phylogenetic comparative methods is an active research area. If we consider only those implemented in the popular R platform, there are already quite a few. RPANDA forms part of the effort to develop mathematical tools for exploring the past from present-day data, and to make these tools as easily accessible to the scientific community as possible. This R package is constantly evolving. Indeed, the package is associated with an ongoing 5-year long project funded by the European Research Council PANDA from which the development of a series of new phylogenetic comparative approaches is expected. When the Application paper was published in February this year, the package focused on diversification, with both non-parametric and likelihood-based approaches. Since then, the scope of the package has expanded to include likelihood-based approaches to the analysis of phenotypic evolution, and we have used some of the approaches from the package to perform some (very cool, I think!) empirical analyses. Some of this new work will be presented at Evolution.
Eric Lewitus will give a talk about the non-parametric approaches he has been developing over the last year and a half, which are available in RPANDA, and more specifically about an empirical application of these approaches to be published soon. For more background on Eric’s work (well worth a read!), the methods, which are inspired from graph theory, are fully described here. In brief, this approach converts a phylogeny into a distribution, which we call spectral density profile, that captures the fundamental properties of a phylogeny (such as topology of branching events, lengths of branches, number of tips). We can then use these phylogenetic spectral density profiles, for example, to compare species trees and cluster them according to how similar they look. This provides us with a non-parametric way to classify trees into diversification types. If you are already wondering how many diversification types there are across vertebrates and what this may mean for vertebrate evolution, go see Eric’s talk!
The other approaches available in RPANDA are mostly likelihood-based approaches, which consist of computing the probabilities to see life around us as we see it today (e.g. in our case, empirical molecular phylogenies and/or the phenotypes of present-day species) under a set of models and parameters. If we can compute these probabilities, then we can find the models and parameters that most likely led to what we can see (and measure) today. Some of these approaches, mostly focused on diversification are “old” news, but still relevant. The first example is an approach based on the coalescent process that allows testing hypotheses about equilibrium dynamics. The second example is an approach that allows testing for shifts in diversification rates (speciation and/or extinction) in particular lineages during the evolution of a clade (for example linked to key innovations) while accounting for clade-wise temporal variations of these rates (for example linked to abiotic drivers or biotic interactions). The third example is a model developed by Fabien Condamine that allows us to test the effect of past environmental variations (such as climatic changes) on diversification. Other approaches are more recent news, published within the last year, such as an approach developed by Marc Manceau that allows fitting an individual-based model of diversification inspired from Hubbell’s Neutral Theory of Biodiversity to phylogenetic data, and approaches designed to understand phenotypic evolution rather than diversification.
In the ASN Spotlight Session entitled “The Evolution of Species Interactions”, Jonathan Drury will talk about a model of phenotypic evolution that he has been developing (and which you can read about here), as well as new empirical applications. This model, which we call the “matching competition” model, can be fit to trait datasets to test the hypothesis that the observed traits we see in any clade have been impacted by competition between species throughout the course of evolution. We can also incorporate biogeography into this model. Now if you are wondering what types of traits and which organisms show a signature of competition, don’t miss Jonathan’s talk (Fig. 2)… Models incorporating other types of interactions (even clade-clade interactions such as mutualism) driving coevolution will come out soon from our group and will be incorporated in the RPANDA package, so stayed tuned. This package is now the go-to R package for empiricists interested in testing hypotheses about how species interactions influence trait evolution.

Had he not broken his ankle playing football(!), Julien Clavel would have talked about extensions and new applications of a model of phenotypic evolution, to be published soon, that will also be available soon in RPANDA. This model allows us to test if and how the pace of phenotypic evolution has been influenced by various abiotic and biotic factors. In short, the rate of phenotypic evolution is expressed as a function of explanatory variables recorded across geological times (such as global temperature fluctuations). The model is flexible and gives users the possibility to fit a broad range of scenario with any functional form of variation of the evolutionary rates.

And now for a fun fact about RPANDA: it has its name displayed on the online tree of life explorer OneZoom, attached to a particularly cute species, guess which one? Yes, you got it, the Red Panda (Fig. 3). Now, I hope that this makes you jealous so that you are going to jump on the OneZoom sponsorship page to have your name attached to your own favorite species before someone else gets it first! If you do so, you will not only be happy to see your name, or the name of a friend, on this unique life explorer, you will also be helping the development of the creative project that James Rosindell has been carrying through with little financial support so far.
OneZoom is now a registered charity which aim is to raise public awareness about evolution, biodiversity and the need to preserve it. Clearly a cause that will speak to anyone who has experienced the beauty of the natural life and dedicates their life to understanding how it came to be as it is—that is to say, nearly everybody at Evolution.
Happy Evolution meeting!
