Post provided by Emma R. Bush and Nils Bunnefeld
What is Fourier Analysis?
Strictly speaking, Fourier analysis is the decomposition of any mathematical function into a series of sine and cosine waves (sinusoids). But let’s not talk about maths – how about food instead?

Imagine you’ve just bought a delicious smoothie from your local café. You like the smoothie so much that you want to know the recipe so that you can make it again at home whenever you want. You’re too shy to ask at the café, so you pour the smoothie through a series of special sieves that separate out each of the ingredients and you write down the recipe – 100ml orange juice, 50ml mango juice, 50ml banana purée and a handful of hipster kale (we haven’t tried this recipe, but we’re sure it would be lovely). You’re quite keen to keep drinking the smoothie, so you mix all the separated ingredients back together again, and the smoothie is just as delicious as before.
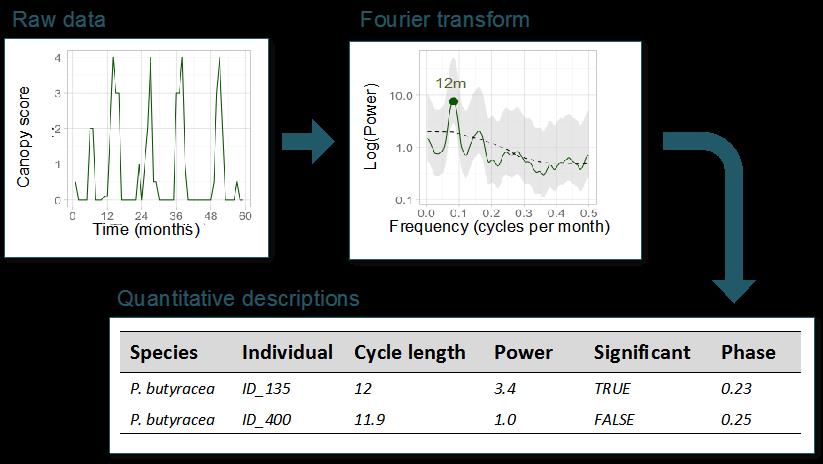
In this brilliant metaphor, developed by Kalid Azad, the smoothie represents some time-series data that you want to analyse, while the set of special sieves is the Fourier Transform used to extract every possible sinusoidal cycle from the data. The recipe is the quantitative description of all cycles (cycle frequency, cycle power – the tendency to appear in the data – and phase) and can be used to reconstruct the original time-series.
Long before smoothie metaphors, Fourier analysis was making waves in mathematics and science. It’s named after the French mathematician Joseph Fourier (1768-1830) who applied the concept of simplifying signals into a series of sinusoidal functions to his study of the properties of heat transfer in the 19th century.
The development of the Fast Fourier Transform (FFT) – named as one of the top 10 algorithms of the 20th century – allowed rapid computation of Fourier analysis. This has facilitated wide application of the Fourier approach in engineering, mathematics and science in recent decades.
Today, Fourier analysis is embedded in many aspects of our everyday life. From the speech recognition, audio communication and image processing functions integral to our modern digital experience (just look at your smart phone), through to seismology, oceanography and x-ray crystallography.
Sinusoids in Nature

Sinusoidal cycles are ubiquitous in nature and form the basis of many research questions in ecology and evolution. Animal hearts beat rhythmically sending blood pulsing in a continuous cycle of high and low pressure. Light and temperature fluctuate around the diurnal cycle with impacts for photosynthetic activity, planktonic movements in the water column, heat-transfer for cold-blooded animals and many other aspects of animal behaviour. Female fertility cycles in species-specific patterns of days or months. Birds sing using complex and often repetitive combinations of notes and tones to signal territorial boundaries and reproductive aspirations. Seasonal climatic cycles force animals to migrate across continents or hibernate for months on end and plants to grow and shed vegetative and reproductive organs.
There are endless examples of natural repeating patterns where external environmental cycles force species to adapt their location, behaviour or physiology to survive. Understanding the drivers of adaptive cyclic behaviour is fundamental to understanding species biology, while detecting and explaining change in cyclic activity is the bedrock of global change research.
Fourier methods have already been employed to analyse many of these cyclic natural phenomena. Fourier has been used to detect diurnal and seasonal movements and foraging strategies for elephants (Wittemyer et al. 2008 and Polansky et al. 2013), lions and buffalo (Polansy et al. 2010) and to demonstrate that scales of movement are driven by scales of environmental change for moose (van Moorter et al. 2013). The approach has also been used extensively in Geographic Information System (GIS) image processing, for noise reduction in Normalized Difference Vegetation Index (NDVI) time-series (Quarshie et al. 2015) and to identify vegetation classes according to phenological fluctuations (Vithanage et al. 2016).
Fourier as a Tool for Tropical Phenology Analysis
Seasonal climatic variation is more limited in tropical regions than in temperate ones, but seasons do exist (often driven by water rather than temperature fluctuations) and plant species have adapted to exploit them. In temperate ecosystems, the characteristic presence of a dormant winter season results in broad synchronisation of phenology on an annual basis. Whereas in the tropics, selective seasonal pressures are often weaker and more diverse (e.g. two rainy and dry seasons per year) leading to much more diverse phenological strategies and loose synchronisation between species.
In our recent paper – Fourier analysis to detect phenological cycles using tropical field data and simulations – we developed methods to apply Fourier analysis to observed tropical phenology data. Fourier provides an objective and quantitative tool to study the re-occurring patterns of flowering, fruiting and leaf production in these complex systems, overcoming the challenges of circular data (where high and low values are arbitrary) and pseudo-replication faced by more conventional linear analyses.
The major challenges to the development of this approach were the lack of data, and ability to confidently differentiate real cycles from noise. Compared to other data that Fourier are regularly applied to (e.g. audio signals or GIS images), observed canopy data are collected at relatively long intervals (often monthly) given the relatively short 6, 12 or 18 months phenological cycles that we expect. To detect cycles with confidence a lot of effort and investment is required to maintain long-term studies, and few sites exist with more than ten years’ data. The longest continuous tropical phenology studies in the world – Lopé National Park, Gabon and Barro Collorado Island, Panama – began in 1984 and 1987 respectively.

In order to distinguish cycles from noise, we developed a confidence test for the dominant cycle (identified through Fourier analysis) for each flowering time series. We also developed a way to quantify the peak timing of flowering events and synchrony between individuals using co-Fourier analysis and simulated cosine curves. Using simulations, and our extensive Lopé field data, we demonstrated the importance of investing resources in long-term data collection as we found confidence in cycle detection to increase over time (although the rate of increase differed vastly between species).
Looking Back to Understand the Future
Using Fourier analysis is slightly harder than making a smoothie, but no less fun, once you have the right tool. Using the Fourier approach has allowed us to test complex hypotheses – developed over years and years of forest observations by the Lopé field researchers – and make use of newly emerging long-term data. Fourier allows the identification of simple quantitative indicators to describe what at first appear to be very complex phenology time series.
Changes in temperate phenology are the most commonly used evidence for ecological impacts of global climate change. But what is happening to tropical phenology? To answer this question we are continuing to develop these Fourier-based methods to test if and how tropical phenology might be changing in response to climate.
To find out more about Fourier analysis, read our Methods in Ecology and Evolution article ‘Fourier analysis to detect phenological cycles using tropical field data and simulations’.

One thought on “Smoothies and Sinusoids: Why Fourier Analysis is a Great Tool for Tropical Phenology”