Post provided by Christopher Nadeau
Climate change could cause the extinction of one in six species and change the abundance and distribution of those that remain (Urban, 2015). This doesn’t necessarily mean that one in six species in your backyard will go extinct though. Climate change impacts will vary greatly around the globe, with some regions seeing disproportionate effects.
The degree to which climate change will affect species in your region depends on many factors (e.g., land use and species traits), but the amount of climate change that species experience in your region – known as climate change exposure – will certainly be important. For that reason, measuring and mapping climate change exposure is critical for predicting where climate change will have the biggest impacts. Yet, biologists have no agreed upon method to measure exposure and different methods can produce dramatically different results.
A Simple Measure of Exposure and its Limitations
Climate can be defined as a statistical description of weather (e.g., temperature, precipitation) over the course of a long time period, usually 30 years. Most often climate is reduced to the average value of a particular weather variable over a 30-year period of interest. Climate change is then measured as the difference between the averages in two time periods; say the predicted average between 2070-2099 minus the average between 1971-2000.

For example, the map to the left shows projected exposure to changes in average annual temperature. This map suggests that species in the arctic will be exposed to the most temperature change while species in the southern hemisphere will experience the least change. However, there are many problems with this interpretation.
Changes in Average Temperature are Not Equivalent around the Globe
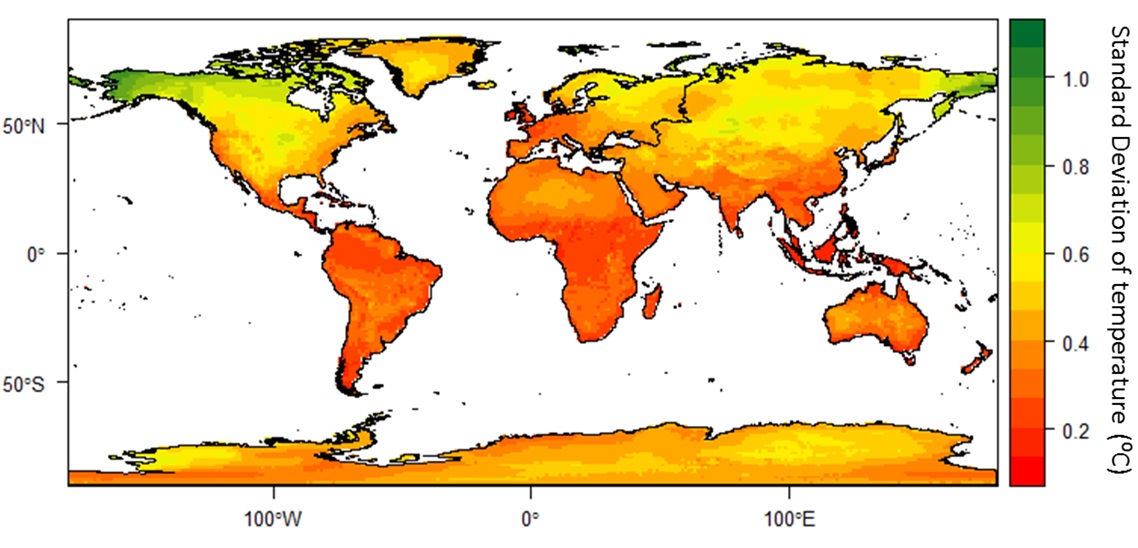
The same change in average annual temperature, say 3°C, will not be equivalent in all locations around the globe. Different regions around the globe have different amounts of temperature variation within and among years. For example, the map to the right shows the standard deviation in annual average temperature between 1971 and 2000. When compared to the map above, it is clear that many locations that are predicted to experience large changes in temperature also have high variation in temperature (e.g., the arctic) and vice versa (e.g., the southern hemisphere). The interaction between temperature variation and temperature change could affect climate change exposure.
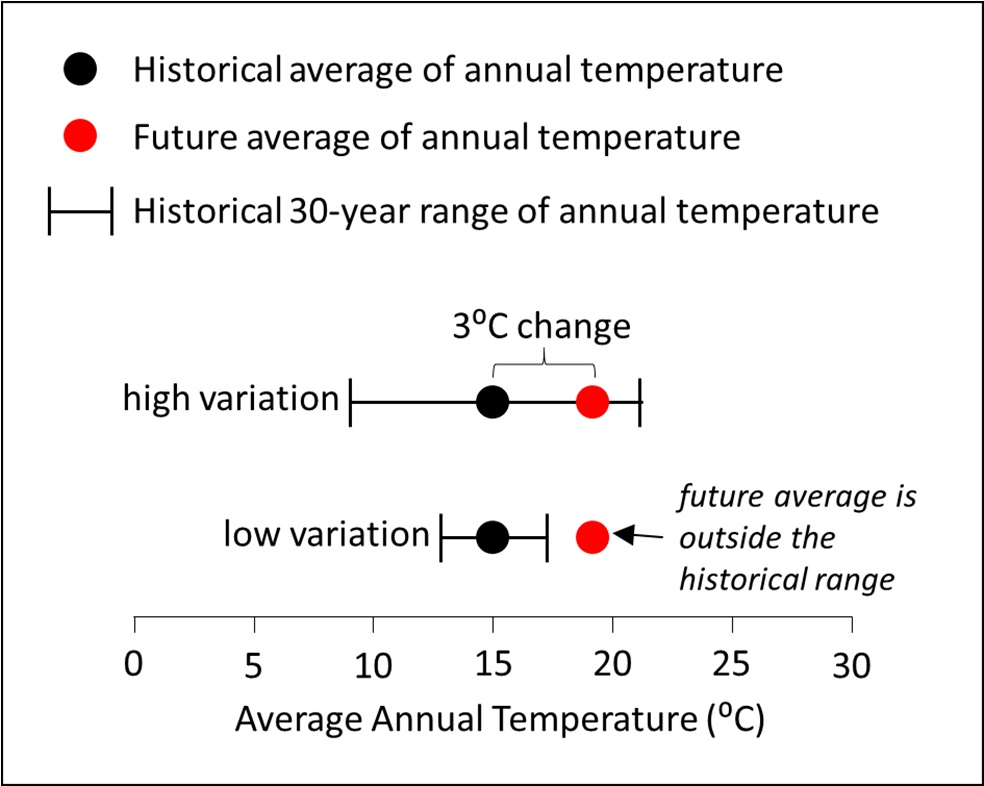
Consider two locations, one with high and one with low temperature variation, and assume that these two locations will both experience a 3°C temperature change by the end of the century. Species from the location with high temperature variation have experienced the future average temperature in the past, but the future average temperature will be completely new to species in the location with lower temperature variation. So, the species from the location with lower temperature variation could be impacted much more from a 3°C change in temperature.
Temperature is not the Only Biologically Relevant Climate Variable
Few climate change impact assessments focus only on changes in temperature, as I have done above. Most assessments also include some measure of the change in precipitation. However, there is a seemingly endless list of other potential changes to climate. For example, global wind speeds have slowed by 5 – 15% over the last three decades. Also, weather variables can be broken down into different time periods (e.g., winter temperature versus summer temperature) further increasing the number of potential weather variables. In order to accurately represent exposure for any given species, estimates of exposure must include the suite of weather variables that affect the fitness of the species or population of interest.
Averages are not the Only Biologically Relevant Climate Statistic
Average temperature is an important aspect related to the distribution and abundance of species, but it isn’t the only important statistic to measure. Variation and extremes in temperature (and other weather variables) can also be very important. Moreover, temperature variation could change under climate change. For example, the daily temperature range is declining in many regions as daily minimum temperatures rise faster than daily maximum temperatures. Measures of exposure that focus solely on changes in the average of weather variables could therefore misrepresent climate change exposure around the globe.
Exposure Indices Combine Multiple Sources of Information on Climate Change
To simplify the complexity of climate change exposure, many different indices of exposure have been developed that incorporate historical variation, multiple climate variables, and/or multiple climate statistics into one number that can be mapped. Some of these indices are listed in the table below.
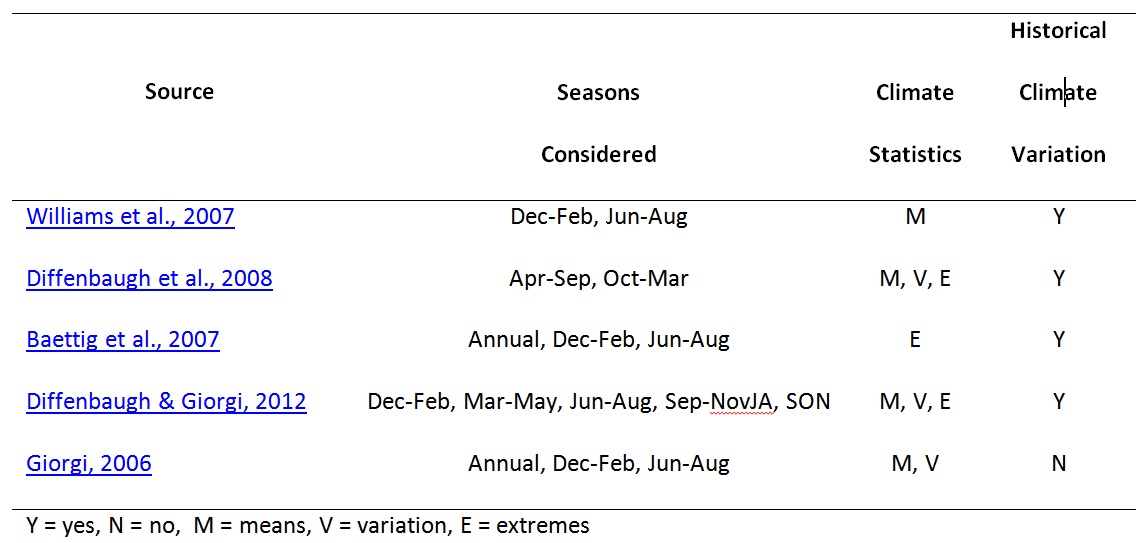
All the indices listed in this table measure changes in both temperature and precipitation, generally in multiple seasons. However, not many indices account for historical weather variation and measure changes in multiple statistics of climate. Those that do, often account for historical weather variation by using the historical variation to estimate the probability of extreme events in the future, where an extreme event is defined as an event that occurs less frequently than an arbitrarily chosen quantile. Also, the final number produced by many of these indices have no intuitive interpretation.
A New Method to Measure Climate Change Exposure
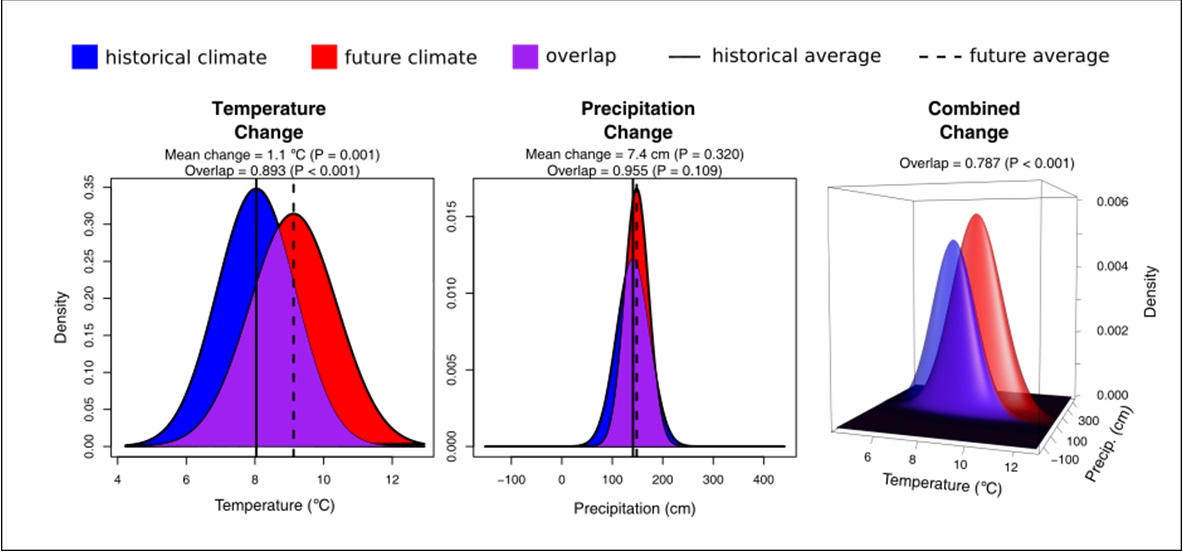
Recently, in ‘Accounting for multiple climate components when estimating climate change exposure and velocity’, my coauthor and I developed a new estimate of climate change exposure that has a more natural interpretation while accounting for many important components of climate. Our method treats climate as a probability distribution of weather, which is a natural way to characterise weather that summarises the average, variation, and extremes. We estimate climate change exposure as the overlap between probability distributions representing historical and future climates. This has a natural interpretation as the expected overlap of weather between the historical and future period. The overlap is measured as a proportion and is scaled between 0 (completely new future weather) and 1 (very similar weather to the historical period).
Because the historical weather variation is represented in the historical probability distribution, our approach accounts for the historical weather variation when measuring changes in all statistics of a weather variable. Also, our method does not require the subjective definition of extremes used in other indices. Because the probability distribution represents both the average and the variation in weather, our method simultaneously measures multiple statistics of climate. And, it can measure the change in multiple weather variables simultaneously by extending the probability distributions to multivariate probability distributions.
In ’Accounting for multiple climate components when estimating climate change exposure and velocity’, we show how to partition this estimate of exposure into changes in the average weather and changes in the variation of weather. We also describe how to estimate the statistical significance of the overlap between probability distributions and how to incorporate our metric into estimates of climate change velocity.

Our method produces spatial patterns of climate change exposure that are much different than the map of temperature change presented above and also different from spatial patterns of exposure produced by other indices. For example, our method suggests that climate change exposure will be high in many tropical regions and many regions in the southern hemisphere. These differences mainly occur because changes in the average of each weather variable are evaluated in light of the historical weather variation, as described above.
Comparing Indices is the Next Step for Biologists
Biologists can choose among many indices when they want to measure climate change exposure. But, differences in the spatial patterns of exposure among indices could have a large effect on estimates of where species will be most vulnerable to climate change. That’s why I advocate for research to compare multiple methods for estimating climate change exposure. This research could help guide the choice of exposure estimates, which would significantly improve our ability to determine where climate change is likely to have the biggest impact on species.
To find out more, read our Methods in Ecology and Evolution article ‘Accounting for multiple climate components when estimating climate change exposure and velocity’.
This article is part of our Biogeography Virtual Issue. All articles in this Virtual Issue are freely available for a limited time.
References from the Table
Baettig MB, Wild M, Imboden DM (2007) A climate change index: where climate change may be most prominent in the 21st century. Geophysical Research Letters, 34, 1-6.
Diffenbaugh NS, Giorgi F, Pal JS (2008) Climate change hotspots in the United States. Geophysical Research Letters, 35, 1-5.
Diffenbaugh NS, Giorgi F (2012) Climate change hotspots in the CMIP5 global climate model ensemble. Climatic Change, 114, 813-822.
Giorgi F (2006) Climate change hot-spots. Geophysical Research Letters, 33, 1-4.
Williams JW, Jackson ST, Kutzbach JE (2007) Projected distributions of novel and disappearing climates by 2100 AD. Proceedings of the National Academy of Sciences, 104, 5738-5742.

3 thoughts on “How Should Biologists Measure Climate Change?”