Post provided by Gabriella Leighton
Online Images: A Treasure Trove of Ecological Data
In the proclaimed ‘information age’, where answers are available at the click of a button or a swipe of a finger, we have become accustomed to the ability to get an almost instant grasp of any topic. Other fields are already making use of this wealth of easily accessible online data, but biologists and ecologists tend to let it slip by. However, this attitude is slowly beginning to change. Some ecological and evolutionary studies are emerging that have used the internet to gather data – through online citizen science projects (e.g. Evolution MegaLab) or databases (e.g. using Google Trends) – but few have used existing data, particularly publicly available data from image repositories.
We were curious to apply the concept of using existing images on the internet to a fascinating visual biological phenomenon: colour polymorphism (or the occurrence of multiple discrete colour phenotypes). To do this, we planned to exploit an existing penchant people have for uploading photographs of animals to the Internet.

Along with the thousands of pictures of cats, people all over the world also upload photographs of wildlife to media sharing websites, stock photograph websites, blogs and everything in between. In many cases the photographers are kind enough to accompany these wildlife images with other information, such as location and date – making them really useful to ecologists! In our case, we were interested in how colour morph proportions change over a landscape, so a pretty accurate photograph location was important.
The easiest way to search for photographs, as many would agree, is to use Google Images. Looking through the images this search engine returned for a short search phrase on the colour polymorphic species of interest (being careful not to bias it with searches for specific morphs), we were able collect locational information for individuals of different morphs. To test our method, we essentially re-did a few case studies using only Google Images. Our paper makes a comparison of findings of established, published trends in spatial patterns of colour polymorphism, with our findings from the new Google Images method – and we found the two were very similar.
Not-so-Black Bears
One of our best examples was black bear colour morphs in western North America. The species has several morphs, from the rare creamy white Kermode bears of British Columbia, to cinnamon, to black, and, in the freezing far north of the species range, they can be blue-grey in colour.
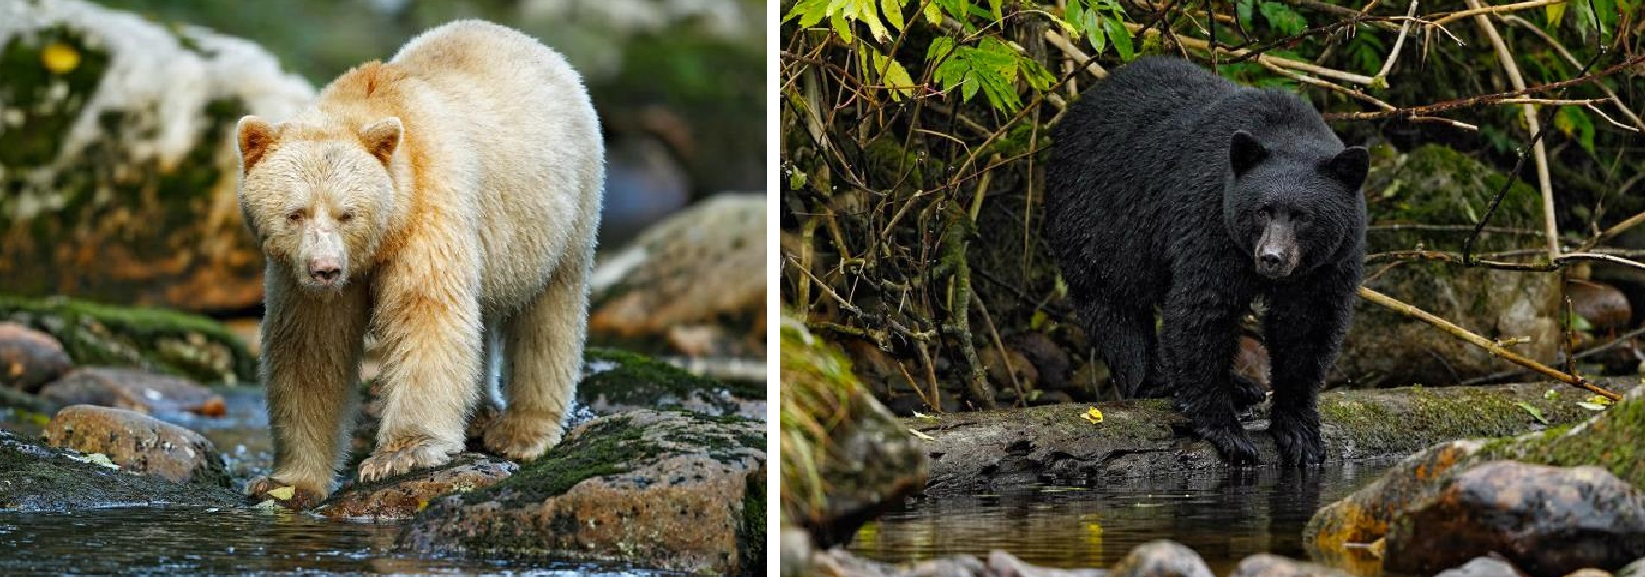
Intensive previous study over several years revealed that there are more colourful bears as one moves south in the Rocky Mountain areas and eastward from the Pacific Coast inland. Our results mirrored this pattern, and only took a few weeks! The best part is that anyone could do it.

While black bears turned out to be a good case study, we also looked at a few species of birds which exhibit colour polymorphism which varies with location: colour and spottiness of barn owls globally and colour of black sparrowhawks in South Africa. We also were able to describe the hybrid zone between two relatively recently delimited species, the hooded and the carrion crow, by plotting sightings of each species across Europe.
How to Use Morphic
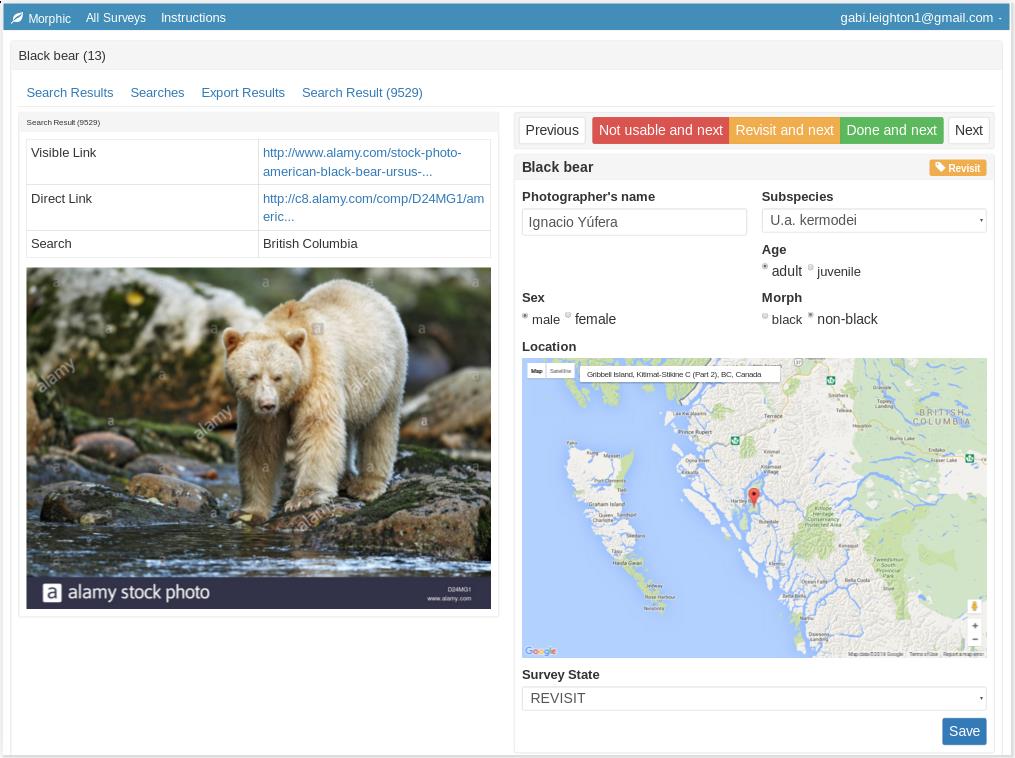
This method works best for species that are conspicuous, fairly common and very well photographed (many bird species fit this description). Our hope is that other researchers will test our method with other previously studied species, or to take a look at patterns in understudied systems. To encourage this, we wanted to make our method easy to use and repeatable, so we developed the web application Morphic. To use Morphic, you just need to sign up, download the Google Chrome extension and create a survey form. This survey form is then filled in for each image that is retrieved from Google Images for a particular search. In the instructional video below we use the black bear example to explore colour morphs in Wyoming (this is a visual demonstration, there is no audio). The website is simply set up and it is easy to use: just follow the clear instructions available.
It’s quite important to decide carefully the kind of questions to ask and information to record from each image before creating a survey. For example, making a note of the photographer’s name and contact details can be important, as well as including all the possible options for a variable in drop-down lists.
Provided the species is chosen carefully and enough images are available, our method can be used as a reliable preliminary measure to determine if fieldwork is necessary; to supplement fieldwork by filling in specific gaps in sampling; or to replace fieldwork where time and funding are limited. Although our study focused on gathering information on the spatial distribution of visual phenotypes, the Google Images method has the potential to be used in a wide variety of ecological and evolutionary research.
To find out more about the Google Images method, read our Methods in Ecology and Evolution article ‘Just Google it: assessing the use of Google Images to describe geographical variation in visible traits of organisms’.
Gabriella Leighton won the 2016 Robert May Early Career Research Award for this paper. It will be freely available is the BES Early Career Researcher Awards Virtual Issue for a limited time.

One thought on “Googling for Ecological Answers: Using the Morphic Web Application”