
Post provided by Anusha Bishop (she/her)
Global biodiversity loss and increased availability of genomic-scale data has motivated a growing interest in conserving genetic diversity. To do so, we need tools that help us understand how genetic diversity is distributed. In pursuit of this, we have developed a new method for creating maps of genetic diversity using spatial moving windows, which we have implemented in the R package wingen.
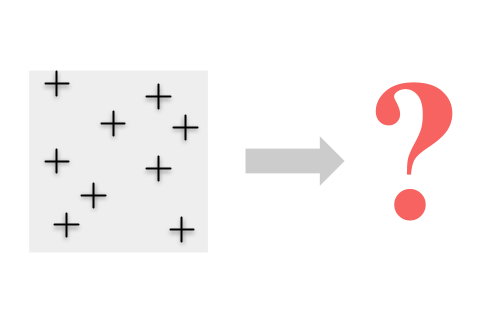
How do you map genetic diversity?
The question seems straightforward enough: if we can map species diversity, why can’t we do the same thing for genomic diversity? The challenge in doing so is with how we go about measuring genetic diversity.
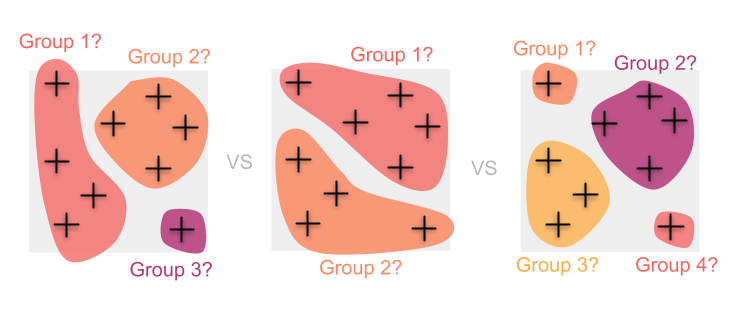
Traditionally, we estimate genetic diversity by first grouping individuals into populations. In those cases, calculating metrics of genetic diversity (e.g. heterozygosity or allelic richness) for each of these populations is straightforward.

This approach works well when we are able to cluster individual samples into discrete groups or when we are confident about which individuals belong to certain populations. But what happens when individuals are distributed continuously and grouping them isn’t straightforward?
In this case, grouping individuals requires difficult (and often somewhat arbitrary) decisions about how exactly to cluster samples. Doing so can introduce biases into our diversity estimates and can also result in the loss of information along the way.
Instead, we may want to avoid imposing any a priori groupings and take advantage of the information contained in all of the individuals by mapping genetic diversity continuously.
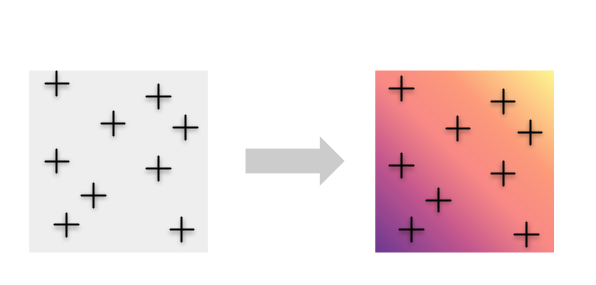
To accomplish this, we developed a new method called wingen, which uses a moving window approach to estimate genetic diversity continuously across space.
To understand how wingen works, first picture a landscape as a grid of cells (i.e., a raster). Then imagine a rectangular window that traverses the landscape. Each time the window moves, a new cell becomes its focal point at the window’s center. All of the samples that fall within the window around each of these focal cells is used to calculate the genetic diversity value of that cell. In short, each cell of the landscape is assigned a genetic diversity value based on the samples that fall within the window surrounding it. We illustrate this process below:
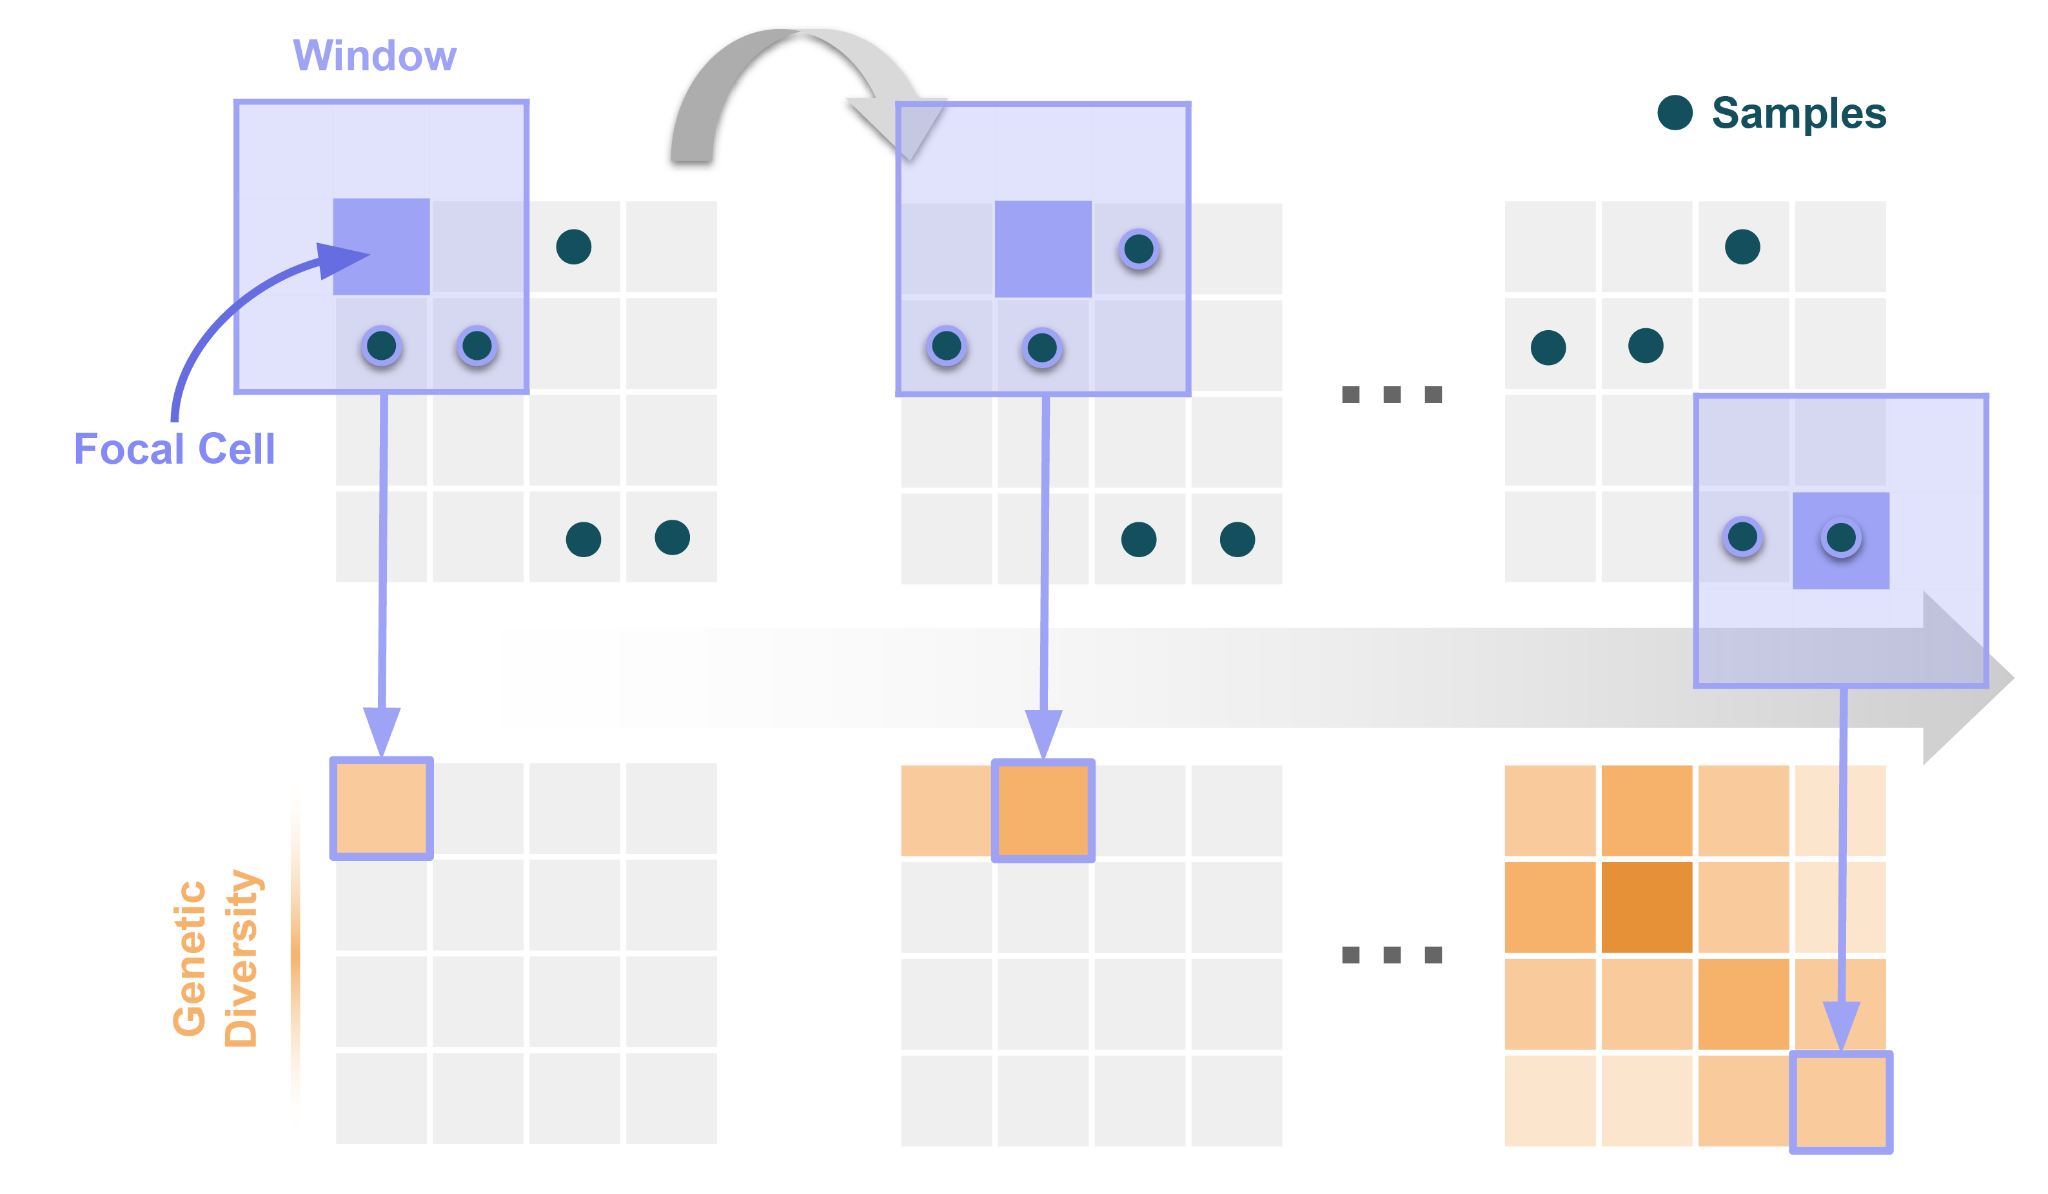
Using this approach, wingen outputs a continuous map of genetic diversity that can be used for conservation prioritization as well as downstream population and landscape genetic analyses. All you need to create these maps of genetic diversity are a Variant Call Format (VCF) file and sample coordinates.
How does wingen work?
The core functionality of wingen can be broken down into three functions: (1) window_gd, (2) krig_gd,and (3) mask_gd.
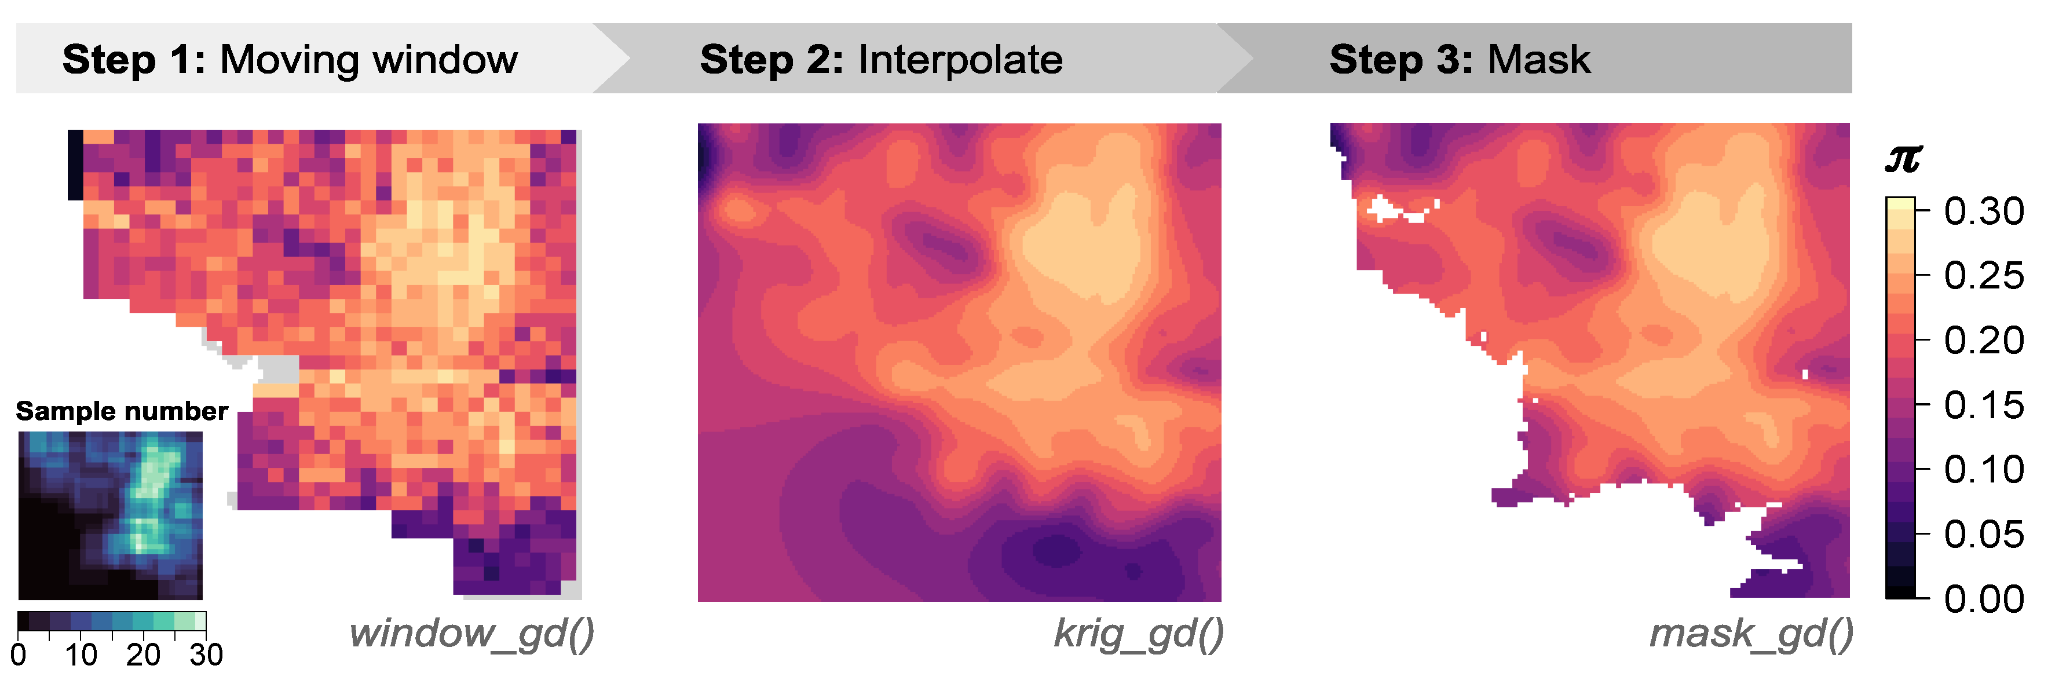
First, window_gd creates the continuous moving window maps of genetic diversity using your sample coordinates and a VCF file containing genetic data for each sample. The output is a raster in which each cell has a genetic diversity value. You can map different measurements of genetic diversity, including nucleotide diversity (pi), allelic richness, or heterozygosity. If your samples are unevenly distributed across the landscape, wingen also provides options for rarefaction when calculating these statistics that helps deal with the effects of variation in sample size.
The raster output by window_gd can be used on its own, or krig_gd can be used to perform interpolation using kriging. Interpolation helps smooth out discontinuities and noise created by the moving window, allowing for clearer visualizations of spatial patterns of genetic diversity.
Finally, mask_gd can take in either the original moving window raster from window_gd or the interpolated raster from krig_gd and be used to exclude parts of the genetic diversity map. For example, you may not have sampled certain regions well, or you may not be interested in areas outside of a given region of interest (e.g., your study organism’s range). In such cases, you could use mask_gd to mask these areas from your final wingen map. The mask_gd function is especially useful for the kriged layers where you may not want to have interpolated genetic diversity in areas with no sampling.
More information about all of these functions can be found in the package vignette or in our original paper (Bishop et al., 2023).
Final thoughts
One of our main goals in developing wingen was to make it easy to use. We wrote wingen to take in simple inputs (i.e., coordinates and VCFs) and produce simple outputs (i.e. rasters) that can be used for downstream analyses in R or output to programs like ArcGIS. wingen also runs very quickly. On standard RADseq-type datasets (i.e., hundreds of individuals and thousands of single nucleotide polymorphisms) it often runs in seconds. Larger datasets and landscapes will of course take longer but can easily be sped up by taking advantage of the built-in options for parallelization. The speed of wingen not only makes testing different parameters computationally tractable, but also makes it a valuable tool for the initial exploration of datasets.
The latest version of wingen can be installed from GitHub. Work on wingen is ongoing and we hope to roll out new features in the future, including additional genetic diversity statistics and different window options. Any suggestions or recommendations are appreciated, especially if you find bugs along the way. To report any issues, you can either submit an issue or pull-request on our GitHub or send me an email (anusha.bishop@berkeley.edu).
You can read more in the full article:
“Generating continuous maps of genetic diversity using moving windows”
