The recent focus on the study of animal social networks has led to some fundamental new insights. These have spanned across fields in ecology and evolution, ranging from epidemiology and learning through to evolution and conservation. Whilst network analysis has been used to address questions about sociality, food webs, bipartite networks and more over the past decade it is now extending into a wider variety … Continue reading Animal Social Networks: Joint Special Feature Open Call
Post provided by Damien Farine, Sebastian Sosa, David Jacoby, Mathieu Lihoreau and Cédric Sueur
Social network visualization. Photo by Martin Grandjean CC-SA.
Here at Methods in Ecology & Evolution and the Journal of Animal Ecology we are excited by the new directions that the next decade of research into animal social networks will bring. We hope to encourage new advances in the study of animal social networks by calling for high-quality papers for a cross-journal Special Feature on animal social networks. Below, Damien Farine and the Special Feature Guest Editors have reviewed some areas of animal social network research that deserve particular attention.
Methodological Gaps
Network Metrics
There are a wide variety of network metrics (node-based, dyadic, and global) and the application and development of new metrics continue to evolve. It is crucial to consider how the values generated by a network metrics (new and old) are interpreted biologically and recognize their limitations. It would be useful to have manuscripts that address questions about:
How mathematical definitions of different network metrics translate to biological processes;
Which metrics provide similar, redundant, or unique information relative to other metrics.
Analysis of datasets collected on marked individuals has spurred the development of statistical methodology to account for imperfect detection. This has relevance beyond the dynamics of marked populations. A couple of great examples of this are determining site occupancy or disease infection state.
EURING Meetings
The regular series of EURING-sponsored meetings (which began in 1986) have been key to this development. They’ve brought together biological practitioners, applied modellers and theoretical statisticians to encourage an exchange of ideas, data and methods.
Modelling species distributions involves relating a set of species occurrences to relevant environmental variables. An important step in this process is assessing how good your model is at figuring out where your target species is. We generally do this by evaluating the predictions made for a set of locations that aren’t included in the model fitting process (the ‘testing points’).
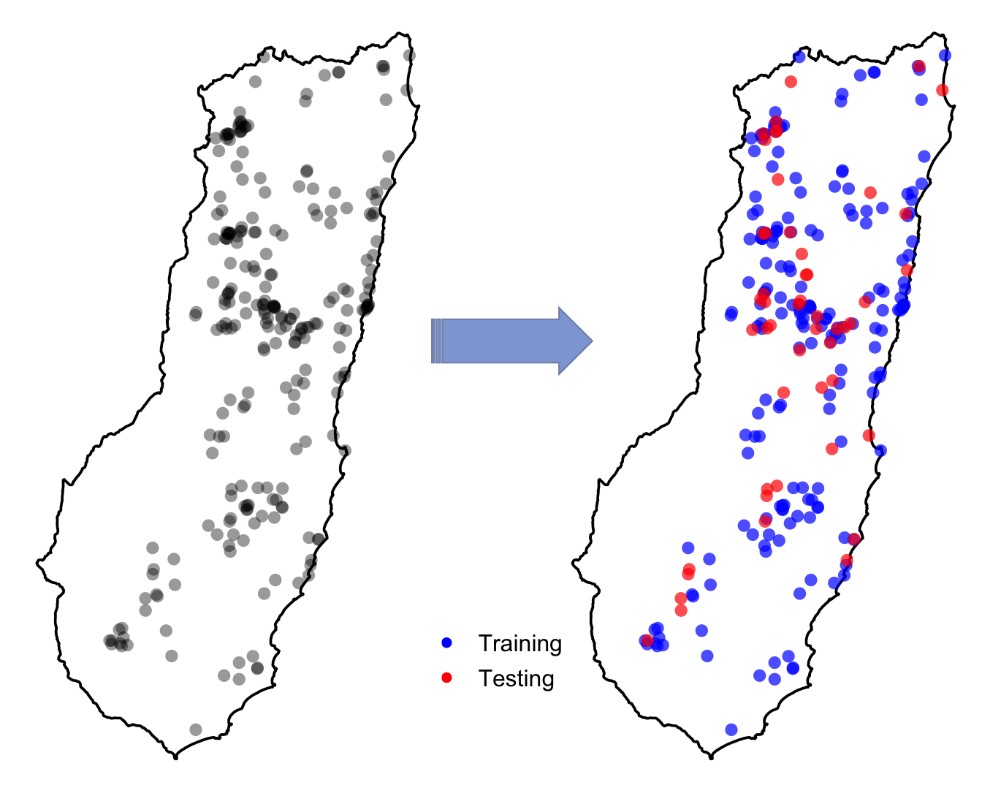
Random splitting of the species occurrence data into training and testing points
The normal, practical advice people give about this suggests that, for reliable validation, the testing points should be independent of the points used to train the model. But, truly independent data are often not available. Instead, modellers usually split their data into a training set (for model fitting) and a testing set (for model validation), and this can be done to produce multiple splits (e.g. for cross-validation). The splitting is typically done randomly. So testing points sometimes end up located close to training points. You can see this in the figure to the right: the testing points are in red and training points are in blue. But, could this cause any problem? Continue reading “Spatial Cross-Validation of Species Distribution Models in R: Introducing the blockCV Package”
مدلسازی توزیع گونهها به تخمین و برآورد ارتباط بین مجموعهای از نقاط حضور گونه با متغیرهای زیستمحیطی مرتبط می پردازد. یکی از مراحل اساسی این فرایند، ارزیابی قدرت مدل برای پیشبینی مکانهایی است که احتمال حضورگونه در آنجا وجود دارد. این کار اغلب با ارزیابی پیشبینی انجام شده در مجموعهای ازنقاط که در فرآیند مدلسازی مورد استفاده قرار نگرفته اند (نقاط آزمایشی) صورت میگیرد.
تقسیم تصادفی دادههای حضور گونه به نقاط آزمایشی و آموزشی
مطالعات پیشین بر این نکته تاکید دارند که به منظور ارزیابی معتبر، نقاط آزمایشی باید مستقل از نقاط آموزشی باشند، این درحالیست که داده مستقل واقعی به ندرت در دسترس می باشد. به همین دلیل، در فرایند مدلسازی معمولا دادههای موجود را به دو قسمت دادههای آموزشی (برای کالیبره کردن مدل) و داده های آزمایشی (برای ارزیابی دقت مدل) تقسیم میکنند، این استراتژی میتواند چند قسمتی هم باشد (برای مثال اعتبارسنجی متقاطع یا cross-validation). از آنجاییکه این تقسیم بندی معمولا بصورت تصادفی انجام میشود، بنابراین گاهی اوقات نقاط آزمایشی در فواصل نزدیک به نقاط آموزشی قرار میگیرند. شکل زیر این مساله را به خوبی نشان می دهد که در آن نقاط آزمایشی به رنگ قرمز و نقاط آموزشی آبی هستند. اما آیا این مساله میتواند مشکلی ایجاد کند؟ Continue reading “اعتبارسنجی متقاطع مکانی در مدلسازی توزیع گونهها”
Anyone who studies social animals in the wild (or human groups, for that matter), will soon find that some individuals threaten or attack others frequently, while others try to get out of the way or signal their submission in response to aggression. Observers tally the outcome of such aggressive interactions between any given two individuals (or ‘dyads’) and try to deduce the rank hierarchy from such winner-loser matrices. One drawback of this approach is that all temporal information is lost.
Imagine Royal, a baboon, dominating over Power, another baboon, 20 times, and Power dominating over Royal 20 times as well. If we just look at these data, we might think that they have the same fighting ability and similar ranks. But, if we know that Royal beat Power the first 20 of the interactions, then Power beat Royal in all further interactions, we’d come to a totally different conclusion. We’d infer that Power had toppled Royal and a rank change had taken place.
Imagine you’re the manager of a national park. One that’s rich in endemic biodiversity found nowhere else on the planet. It’s under the influence of multiple human pressures causing irreversible declines in the biodiversity, possibly even leading to the extinction of some of the species. You’re working with a complex system of multiple species and threats, limited knowledge of which threats are causing the biggest declines and limited resources. How do you decide what course of action to take to conserve the biodiversity of the park? This is the dilemma faced by biodiversity managers across the globe.
Statistical and quantitative methods within ecology have increased substantially in recent years. This rise can be attributed both to the growing need to address global environmental change issues, as well as the increase in data sources to address these challenges. Continue reading “Statistical Ecology Virtual Issue”
Like all living things, plant species must reproduce to persist. Key stages in successful plant reproduction must be carefully timed to make sure resources are available and conditions are optimal. There will be little success if flowers mature in bad weather conditions for their insect pollinators or if fruits ripen but the seed dispersers have migrated elsewhere.
Opportunistically collected species observation data, or citizen science data, are increasingly available. Importantly, they’re also becoming available for regions of the world and species for which few other data are available, and they may be able to fill a data gap.
In Sweden, over 60 million citizen science observations have been collected – an impressive number given that Sweden has a population of about 10 million people and that the Swedish Species Observation System, Artportalen, was created in 2000. For bird-watchers (or plant, fungi, or other animal enthusiasts), this is a good website to bookmark. It will give you a bit of help in finding species and as a bonus, has a lot of pretty pictures of interesting species. Given the amount of data citizen science can provide in areas with few other data, it’s important to evaluate whether they can be used reliably to answer questions in applied ecology or conservation. Continue reading “Can Opportunistically Collected Citizen Science Data Create Reliable Habitat Suitability Models for Less Common Species?”