Post provided by Roozbeh Valavi
Modelling species distributions involves relating a set of species occurrences to relevant environmental variables. An important step in this process is assessing how good your model is at figuring out where your target species is. We generally do this by evaluating the predictions made for a set of locations that aren’t included in the model fitting process (the ‘testing points’).
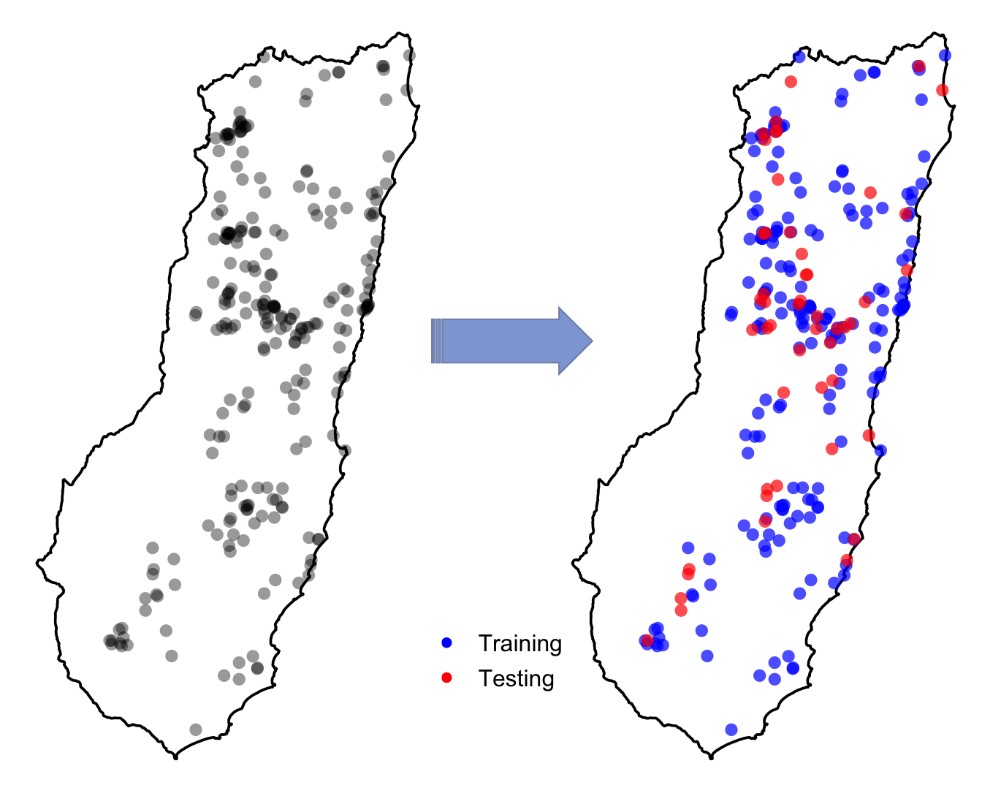
The normal, practical advice people give about this suggests that, for reliable validation, the testing points should be independent of the points used to train the model. But, truly independent data are often not available. Instead, modellers usually split their data into a training set (for model fitting) and a testing set (for model validation), and this can be done to produce multiple splits (e.g. for cross-validation). The splitting is typically done randomly. So testing points sometimes end up located close to training points. You can see this in the figure to the right: the testing points are in red and training points are in blue. But, could this cause any problem?
The Problem with Spatial Autocorrelation
Indeed, it might! The issue is that these sorts of splits can lead to an over-estimation of the predictive power of the model. This is because of a phenomenon called spatial autocorrelation – i.e. the fact that observations close to each other have similar characteristics. Or as stated by the so-called ‘first law of geography’: everything is related to everything else but near things are more related than distant things!
When training and testing locations fall close to each other, because of spatial autocorrelation the characteristics of the testing points will be similar to the ones that have been seen by the model (training points) during the model fitting process. So, it’s relatively easy for the model to predict at these locations. As a result, the evaluation result will be too optimistic for locations further away.
To overcome this issue, we need to have training and testing points far enough apart in geographic (or environmental) space to give us more “independent” datasets. The easiest way to do this is to separate the data based on their spatial coordinates (longitude and latitude). The idea is to divide the study area into spatial units – or blocks – and assign observations falling in these blocks to cross-validation folds. The process of evaluating the models with folds constructed this way is called block cross-validation (Roberts et al. wrote an excellent paper about the technique and its application to different types of ecological data).

But this is easier said than done! Creating blocks and assigning the data to cross-validation folds can be time-consuming. In many cases, it’s also difficult to code (e.g. with species data that are unevenly distributed across a landscape). The R package blockCV is a new toolbox that makes this task easier for you. It generates cross-validation folds following three different strategies: buffering, spatial and environmental blocking.
It’s also equipped with a tool for measuring the effective range of spatial autocorrelation in the predictor variables to guide the user for a first choice of block size prior to any model fitting. There are interactive tools to check the allocation of species observation points to cross-validation folds and to select a proper spatial block size and investigate its impact on the arrangement of species data across blocks. The package has different ways to create spatial blocks and to allocate blocks to cross-validation folds. We introduce some of the functionalities of the package below. For more information about other tools and blocking strategies in the blockCV package, please read our applications article ‘blockCV: An r package for generating spatially or environmentally separated folds for k‐fold cross‐validation of species distribution models’ (freely available to everyone, no subscription required).
Choosing Block Size Based on Spatial Autocorrelation in the Data

One challenge here is how to specify the size of the spatial block for separating training and testing data. A common practice is to look at the spatial autocorrelation range in the model residuals. To get the residuals you usually need to have fitted the model though. To guide a first choice of block size, blockCV package has a function to measure the effective autocorrelation range of all predictor variables, to indicate the scale of spatial structure in the landscape.
Choosing Block Size Based on User Choice

The size of spatial blocks can also be directly chosen by the user. To visualize blocks of different sizes over the study area and optionally check how species data fall into these blocks, blockCV offers an interactive tool created as a shiny app in R. With this tool, you can specify a range of values (in metres) to create spatial blocks interactively and see how these cover the area and the species data.
The package is written with species distribution modelling in mind, with output formats to suit various approaches to modelling, including formats required by the package ‘biomod2’. However, we expect it will be useful more widely, and will be interested to see its varied applications. You can download the blockCV package and access the online vignette via GitHub.
To find out more about blockCV, read our Methods in Ecology and Evolution applications article, ‘blockCV: An r package for generating spatially or environmentally separated folds for k‐fold cross‐validation of species distribution models’ (freely available, no subscription required).

Nice work, but missed to mention existing work on the choice of samples considering spatial auto-correlation and environmental conditions (https://zslpublications.onlinelibrary.wiley.com/doi/pdf/10.1002/rse2.70) as well as existing packages that apply this premise (https://cran.r-project.org/web/packages/rsMove/index.html).