Key Technologies Used to Build the plant Package (and Maybe Soon Some Other Big Simulation Models in R)
Post provided by RICH FITZJOHN and DANIEL FALSTER
Our paper in Methods in Ecology and Evolution describes a new software package, plant. plant is an individual-based simulation model that simulates the growth of individual trees, stands of competing plants, or entire metacommunities under a disturbance regime, using common physiological rules and trait-based functional trade-offs to capture differences among species.
Non-Linear Processes and Thousands of Plants
Since the development of gap models in the 1970s (e.g. Botkin 1972), researchers have been using computer simulations to investigate how elements of plant biology interact with competition and disturbance regimes to influence vegetation demography, structure and diversity. Simulating the competitive interactions among many thousands of plants, however, is no easy task.
Despite widespread recognition of the importance of key non-linear processes — such as size-structured competition, disturbance, and trait-based trade-offs — for vegetation dynamics, relatively few researchers have been brave (or daft) enough to try and incorporate such processes into their models. The situation is most extreme in theoretical ecology, where much contemporary theory (e.g. coexistence theory, neutral theory) is still built around completely unstructured populations.
Features of plant
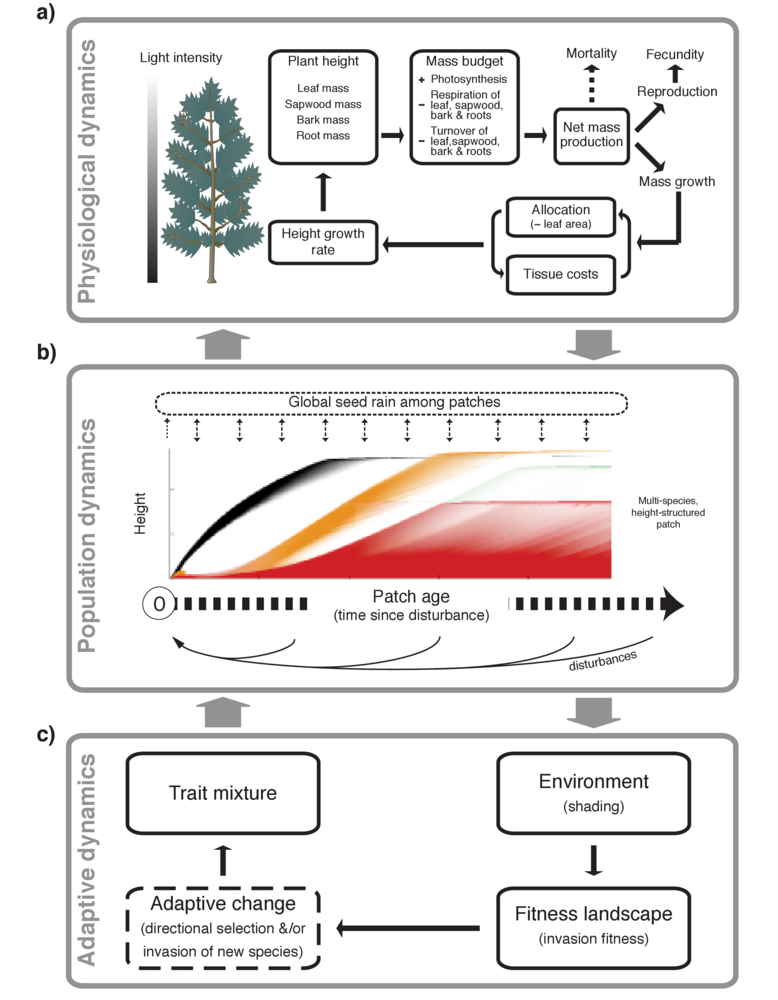
plant package.The plant package attempts to change that by providing an extensible, open source framework for studying trait-, size- and patch-structured dynamics. One thing that makes the plant model significant is the focus on traits. plant is one of several attempts seeking to integrate current understanding about trait based trade-offs into a model of individual plant function (see also Moorcroft et al 2001, Sakschewski et al 2015).
A second feature that makes the plant software significant, is it that is perhaps the first example where a computationally intensive model has been packaged up in a way that enables widespread usage, makes the model more usable and doesn’t sacrifice speed.
In this post we will describe the key technologies used to build the plant software. Continue reading “Key Technologies Used to Build the plant Package (and Maybe Soon Some Other Big Simulation Models in R)”