The seemingly basic question of whether a population is increasing, decreasing, or stable can be one of the most difficult to answer. Collecting data on rare and elusive species is hard. Imagine trying to detect a handful of fisher or wolverine across hundreds of thousands of acres – it is physically demanding, time consuming and logistically complicated. And that’s just to do it once! To monitor a population for changes, you have to repeat these surveys regularly over many years. The long-term monitoring that is necessary for conservation requires careful planning and a substantial commitment of resources and funding. So before we spend these valuable resources, it’s critical to know whether the data we are collecting can help us to answer our questions. Continue reading “Spatially-explicit Power Analysis: A First Step for Occupancy-Based Monitoring”
Typically, ecology courses contain at least a day of matrix population models. So most ecologists are somewhat familiar with how simple life cycles (and complex ones) can be depicted and analysed using matrix models. Briefly, these models represent what happens to individuals over a certain time interval (do they die? do they reproduce? if so, how much?). What individuals do in the context of these models can then be used to study the dynamics of a population.
Often, individuals are classified by size in matrix models, as small individuals tend to have different survival, growth and reproduction rates than large ones. But how many classes do you need to model the dynamics of a size-structured population properly? Instead of choosing arbitrary size class boundaries, Easterling, Ellner and Dixon (2000) came up with the idea of using continuous size variables and integrals to define a population model… and that’s how the first Integral Projection Model (‘IPM’ for us friends) came to be.
Naturally, for the development of a new demographic tool to prove useful to the scientific community, it must be flexible enough to be ‘one-size-fits-all’… and the needs of ecologists, evolutionary biologists and conservation biologists – who have to date used extensively size-based matrix models – are rather variable in size, colour and shape. Continue reading “Stage-dependent Demographic Modelling at Your Finger Tips”
The February issue of Methods is now online! As you may have seen already, it includes the BES cross-journal Special Feature: “Demography Beyond the Population“. There are also eight other wonderful articles to read.
In demography, a set of processes (survival, growth, fecundity, etc.) interacts to produce observable patterns (population size, structure, growth rate, etc.) that change over time. With traditional approaches you follow the individuals of a population over some timespan and track all of these processes.
Demographic patterns and processes (Click to expand)
However, depending on the organism, some processes may be very hard to quantify (e.g. mortality or recruitment in animals or plants with long lifespans). You may have observed the patterns for the organism that you’re studying and, even better, measured some, but not all, of the processes. The question is: can we use this limited information to estimate the processes we couldn’t measure?Continue reading “Inverse Modelling and IPMs: Estimating Processes from Incomplete Information”
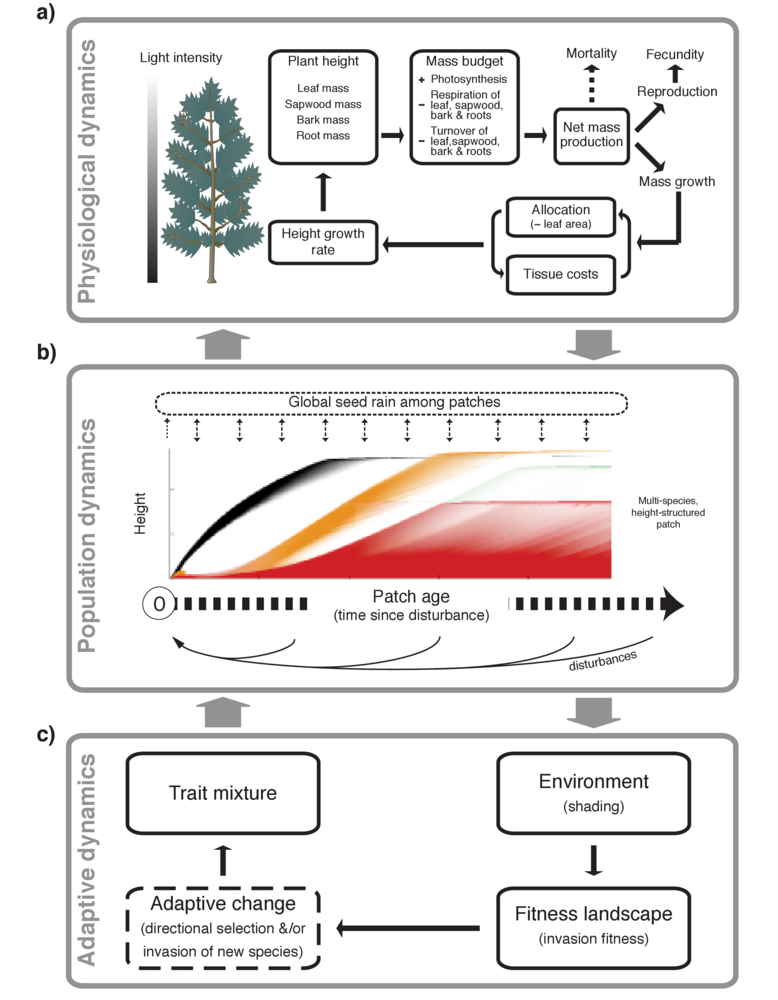
Our paper in Methods in Ecology and Evolution describes a new software package, plant. plant is an individual-based simulation model that simulates the growth of individual trees, stands of competing plants, or entire metacommunities under a disturbance regime, using common physiological rules and trait-based functional trade-offs to capture differences among species.
Non-Linear Processes and Thousands of Plants
Since the development of gap models in the 1970s (e.g. Botkin 1972), researchers have been using computer simulations to investigate how elements of plant biology interact with competition and disturbance regimes to influence vegetation demography, structure and diversity. Simulating the competitive interactions among many thousands of plants, however, is no easy task.
Despite widespread recognition of the importance of key non-linear processes — such as size-structured competition, disturbance, and trait-based trade-offs — for vegetation dynamics, relatively few researchers have been brave (or daft) enough to try and incorporate such processes into their models. The situation is most extreme in theoretical ecology, where much contemporary theory (e.g. coexistence theory, neutral theory) is still built around completely unstructured populations.
Features of plant
Key processes modelled within the plant package.
The plant package attempts to change that by providing an extensible, open source framework for studying trait-, size- and patch-structured dynamics. One thing that makes the plant model significant is the focus on traits. plant is one of several attempts seeking to integrate current understanding about trait based trade-offs into a model of individual plant function (see also Moorcroft et al 2001, Sakschewski et al 2015).
A second feature that makes the plant software significant, is it that is perhaps the first example where a computationally intensive model has been packaged up in a way that enables widespread usage, makes the model more usable and doesn’t sacrifice speed.
“Demography Beyond the Population” is a unique Special Feature being published across the journals of the British Ecological Society. The effort evolved from a symposium of the same name hosted in Sheffield, UK last March. Both the meeting and the Special Feature were designed to challenge ecologists from a range of fields whose research focuses on populations.
The participants were charged with sharing how they are pushing the work they do beyond the stage where the population is the focus into research where the population is just the beginning and the focus spans scales, systems and tools. This encompasses a broad suite of biological research, including range modelling, disease impacts on communities, biogeochemistry, evolutionary theory, and conservation biology. The meeting was a great success, and this Special Feature should be equally valuable to the broad readership of the BES journals.
Methods in Ecology and Evolution has a special place in the Special Feature, hosting four papers. These papers not only introduce new efforts in population biology, they provide the methods that other scientists can use to implement them. With the tools provided by these four papers, researchers will be able to advance forest modelling, evolutionary theory, climate change biology and statistical inference of hidden population parameters. Seriously good stuff! Continue reading “Methods Beyond the Population”
Damselflies marked in the field, which will hopefully be recaptured later. This small insect at our field site had only about 10% recapture probability.
The quantification of survival selection in the field has a long history in evolutionary biology. A considerable milestone in this field was the highly influential publication by Russel Lande and Steve Arnold in the early 1980s.
The practical implementation of Lande and Arnold’s method involved simply fitting a linear model with standardized response (survival) and explanatory (trait) variables values with quadratic terms (multiplied by two). This straightforward method allowed evolutionary biologists to measure selection coefficients using commonly available statistical software and these estimates could be used directly within a quantitative genetic framework. Continue reading “Measuring Survival Selection in Natural Populations: How important is recapture probability?”
Our final issue of 2015 contains one Applications article and two Open Access articles, all of which are freely available.
– stagePOP: A tool for predicting the deterministic dynamics and interactions of stage-structured populations (i.e. where the life cycle consists of distinct stages, for example eggs, juveniles and reproductive adults). The continuous-time formulation enables stagePop to easily simulate time-varying stage durations, overlapping generations and density-dependent vital rates.
Julia Cherry et al. provide one of this month’s Open Access articles. In ‘Testing sea-level rise impacts in tidal wetlands: a novel in situ approach‘ the authors describe the use of experimental weirs that manipulate water levels to test sea-level rise impacts in situ and at larger spatial scales. This new method can provide more robust estimates of sea-level rise impacts on tidal wetland processes. This article was accompanied by a press release when it was published in Early View. You can read more about this article here.
Biodiversity Indicators are some of the most important tools linking ecological data with government policy. Indicators need to summarise large amounts of information in a format that is accessible to politicians and the general public. The primary use of indicators is to monitor progress towards environmental targets. For the UK, a suite of indicators are produced annually which are used to monitor progress towards the Aichi targets of the Convention on Biological Diversity as well as for European Union based commitments. However, this is complicated by the fact that biodiversity policy within the UK is devolved to each of the four nations, so additional indicators have been developed to monitor the commitments of each country.
A range of biodiversity indicators exist within this suite covering the five strategic goals of the Convention; which include addressing the causes of biodiversity loss, reducing pressures on biodiversity and improving status of biodiversity within the UK. Within strategic goal C (improve status of biodiversity by safeguarding ecosystems, species and genetic diversity) there are currently 11 “State” indicators that use species data to monitor progress towards the targets underlying this goal. Most existing species based indicators use abundance data from large scale monitoring schemes with systematic protocols. However, there are other sources of data, such as occurrence records, that can offer an alternative if they are analysed using the appropriate methods. This post will discuss the development of species indicators for occurrence records to complement the current UK species based indicators, specifically relating to the C4b priority species indicator and the D1c pollinators indicator. Continue reading “Building a Better Indicator”
If you’re anything like me, you might experience a minor existential crisis weekly. As scientists we question the world around us and, for me, this questioning turns all-too-often inwards to my career. I don’t think that’s unusual: ask any scientist about their ‘Plan B’, and the extent to which it’s thought through is often astonishing (if a café-cum-cocktail bar ever opens in Glasgow’s West End, which specialises in drinks that employ spice blends from around the world and are named after old spice trade routes and trading vessels, then you know I’ve jumped the science ship).
Contributing open-source software is something which has made my work feel a bit more relevant and helped me feel a bit less of an imposter. I’ll explain why that is, give some tips to beginners for building a first R package, and hopefully persuade other (especially early-career) researchers to do the same. Continue reading “A Quickstart Guide for Building Your First R Package”