Tackling uncertainty in landscape connectivity

Post provided by Maëlis Kervellec  An Increased Interest Towards Landscape Connectivity Human activities not only contribute to climate change by producing greenhouse gases, but also directly degrade habitats. According to the 2019 IPBES report , about 75% of the Earth’s land surfaces have been heavily modified. Moreover, in Europe, 50% of the land is within 1.5 kilometres of a road (Torres, Jaeger, and Alonso, 2016 ). This … Continue reading Tackling uncertainty in landscape connectivity

Introducing sabinaNSDM: A New R Package for Improved Species Distribution Modeling based on Spatially-Nested Hierarchical models

Post provided by Teresa Goicolea and Alejandra Zarzo Esta publicación también está disponible en español. Species Distribution Models (SDMs) are essential tools for scientists and conservationists to predict where species are likely to be found, where they have existed in the past, and where they might appear in the future. As we face urgent issues like climate change and biodiversity loss, producing accurate predictions is … Continue reading Introducing sabinaNSDM: A New R Package for Improved Species Distribution Modeling based on Spatially-Nested Hierarchical models

Introducción a sabinaNSDM: Un nuevo paquete de R para mejorar los modelos de la distribución de especies basado en modelos jerárquicos anidados espacialmente

Post escrito por Teresa Goicolea y Alejandra Zarzo This post in also available in English. Los Modelos de Distribución de Especies (SDMs, por sus siglas en inglés) son herramientas esenciales para que científicos y especialistas de la conservación puedan predecir dónde es probable encontrar especies, dónde han existido en el pasado y dónde podrían aparecer en el futuro. Ante problemas urgentes como el cambio climático … Continue reading Introducción a sabinaNSDM: Un nuevo paquete de R para mejorar los modelos de la distribución de especies basado en modelos jerárquicos anidados espacialmente

voluModel: a new R package to model species distributions in 3 dimensions

Post provided by Hannah Owens (she/her)

One of the base units of analysis for biogeography and conservation science is the species range map. Once we know where a species is, we can ask questions like “Why is it there?”, “How did it get there?”, or “What can we do to make this place better for it?” Especially these days, I am very interested in mapping marine fish distributions, which, it turns out, is not as simple as mapping terrestrial species.

Continue reading “voluModel: a new R package to model species distributions in 3 dimensions”

Issue 11.1: Climate Change, Genomic Divergence, Bayesian Modelling and More

The January issue of Methods is now online!

It’s a new year and the new issue of Methods in Ecology and Evolution is now online!

We’re starting 2020 with a great issue – and ALL of the articles are completely free. And they’ll remain free for the whole year. No subscription required.

You can find out more about our Featured Articles (selected by the Senior Editor) below. We also discuss this month’s Open Access, Practical Tools and Applications articles. There are also articles on species distributions, biotic interactions, taxonomic units and much more.

Continue reading “Issue 11.1: Climate Change, Genomic Divergence, Bayesian Modelling and More”

Issue 10.4: Bayesian Models, Isoscapes, Camera Traps and More

The April issue of Methods is now online!

This month we’re thinking about hierarchical Bayesian models and Approximate Bayesian Computation, improving ecological niche models, and learning how to make our own Environmental Microcontroller Units (more on that below). We’ve got articles on Phylogenetics, Space (not outer space), Camera Traps and much more. Plus, there are six papers that are completely free to everybody, no subscription required!

Find out a little more about the new issue of Methods in Ecology and Evolution (including details about the bobcat on this month’s cover) below. Continue reading “Issue 10.4: Bayesian Models, Isoscapes, Camera Traps and More”

Birds and Climate in Space and Time: Separating Spatial and Temporal Effects of Climate Change on Wildlife

Post provided by Cornelia Oedekoven

The Standard Method

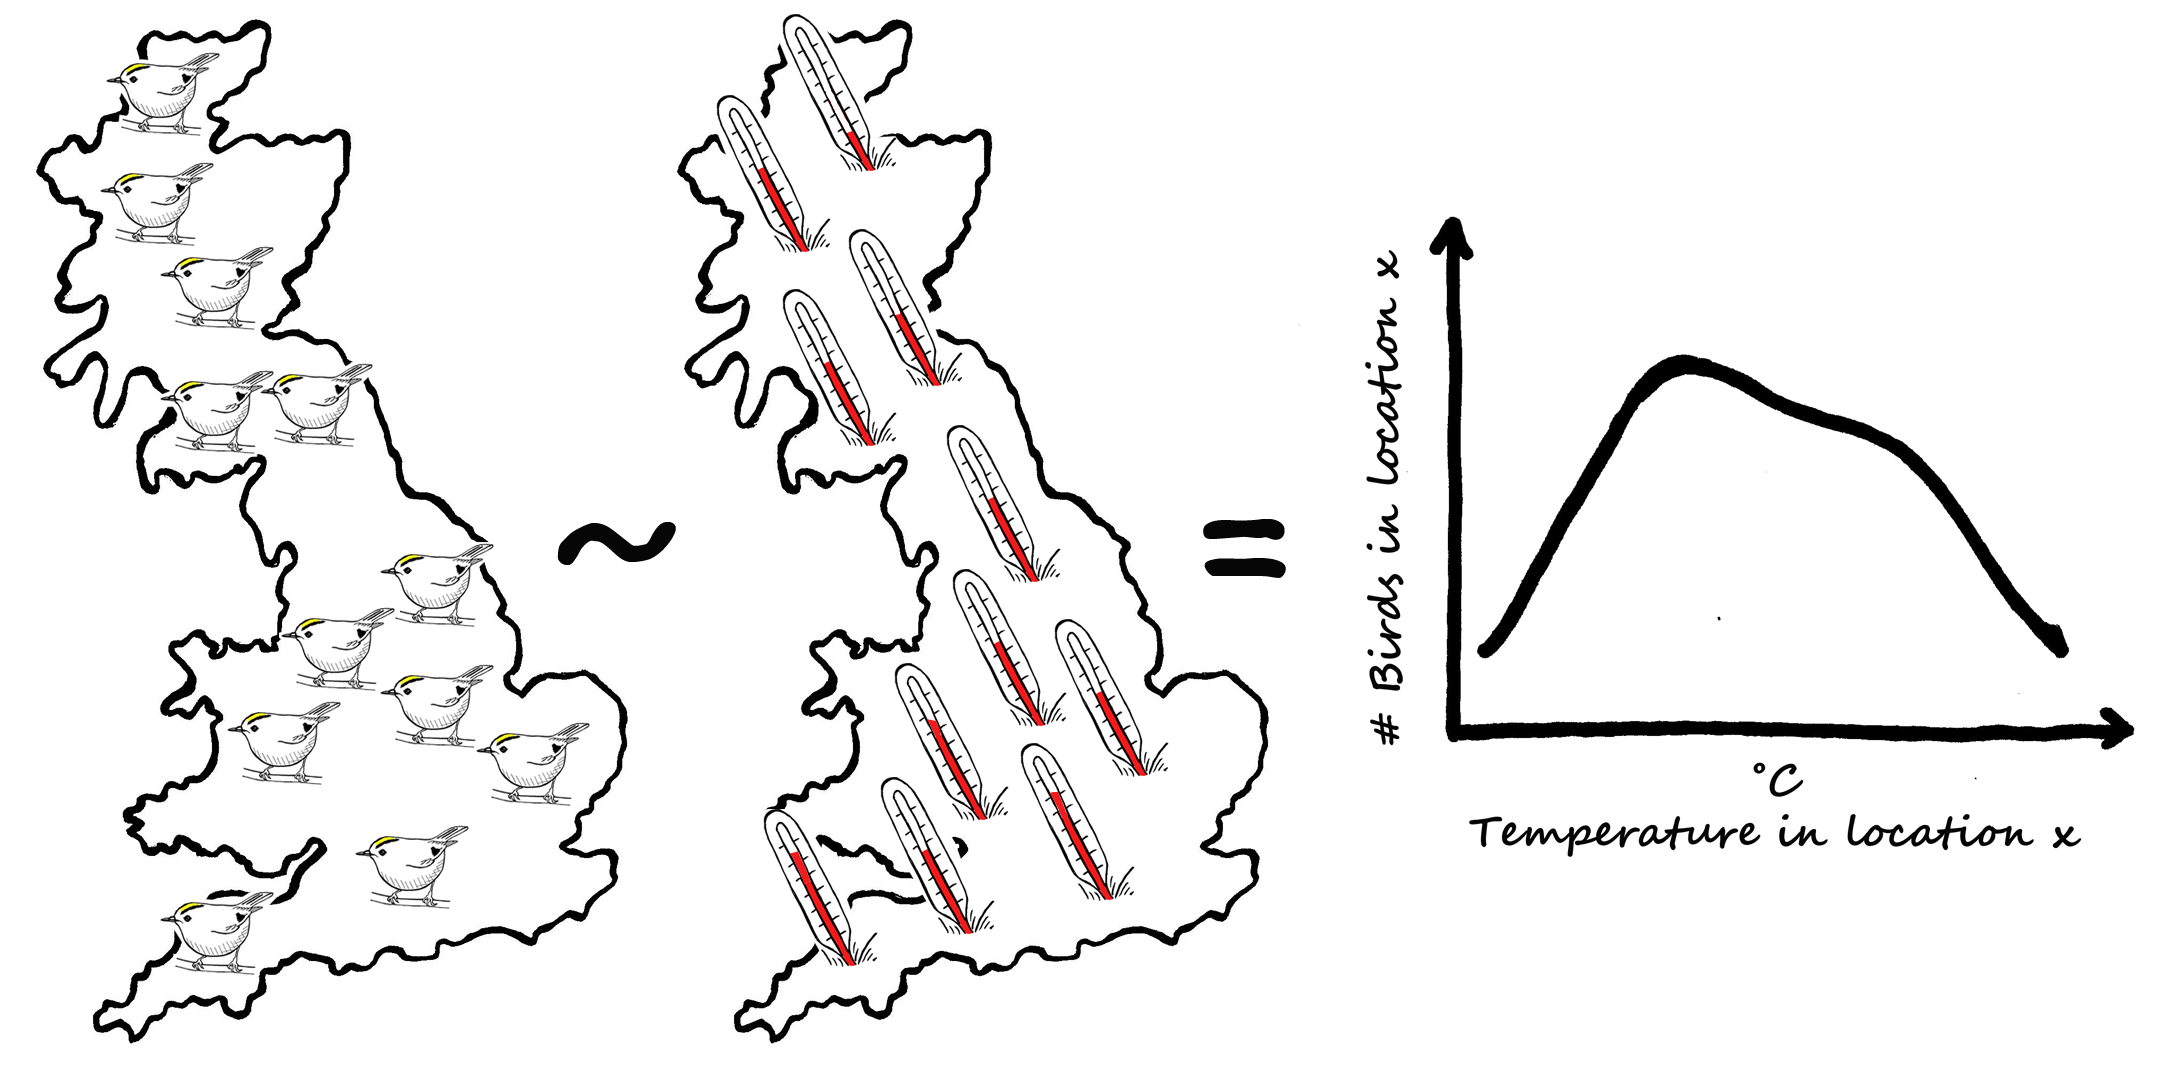
When trying to understand how wildlife, for example a bird species, may react to climate change scientists generally study how species numbers vary in relation to climatic or weather variables (e.g. Renwick et al. 2012, Johnston et al. 2013). The way this tends to be done is by gathering information (data!) about bird numbers as well as the weather variables (for example temperature) in several locations (i.e. in space) and fitting a regression model to these data to detect and illustrate how bird numbers go up or down with temperature.

Data on bird numbers and temperatures in several locations lets researchers see the relationship between the two.

This relationship is then used to forecast how bird numbers may change along with potential temperature changes in the future (i.e. in time), for example due to climate change.

Relationships between bird numbers and temperature in a given location are often used to forecast changes in bird numbers with expected changes in temperatures over time.

Continue reading “Birds and Climate in Space and Time: Separating Spatial and Temporal Effects of Climate Change on Wildlife”

Biogeography at a Global Scale: The Benefits of Distributed Experimental Networks

Post provided by Elizabeth Borer

©NASA
©NASA

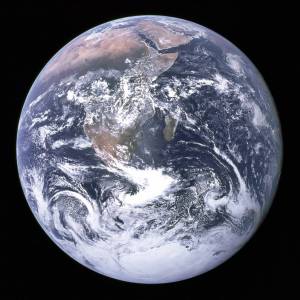
I have always loved the Blue Marble image of Earth from the Apollo 17 mission, yet a large part of my science is focused on experimental responses at the scale of meter squared grassland plots or even individual grass plants. While I spent my early career wanting to be able to say something important about regional or global processes, I found myself feeling like generating any experimental insights into processes and ecosystem responses at larger scales would be an impossible fiction.

As a postdoc, I had the opportunity to do a multi-site study across a north-south precipitation gradient in California and jumped at it. Among other questions, I decided to ask about whether plants and insects varied similarly across sites in response to replicated experimental treatments. Yet, the idea of actually sampling – and then processing samples from – more than about four sites for more than a year or two was utterly daunting. Continue reading “Biogeography at a Global Scale: The Benefits of Distributed Experimental Networks”

Estimating Shifts in Species Distribution: An Interview with James Thorson

David Warton (University of New South Wales) interviews James Thorson (NOAA) about his paper Model-based inference for estimating shifts in species distribution, area occupied and centre of gravity. The article is included in the August 2016 issue of Methods in Ecology and Evolution.  They discuss how to estimate changes in distribution shifts accounting for changes in the spatial distribution of sampling intensity, James’ current workplace NOAA, his academic background and what trouble he is planning to get up to next.

Continue reading “Estimating Shifts in Species Distribution: An Interview with James Thorson”

Biogeographic Regions: What Are They and What Can They Tell Us?

Post provided by Leonardo Dapporto, Gianni Ciolli, Roger L.H. Dennis, Richard Fox and Tim G. Shreeve

Every species in the world has a unique geographic distribution. But many species have similar ranges. There are many things that can cause two (or more) species to have similar ranges – for example shared evolutionary histories, physical obstacles (mountains, oceans etc.) or ecological barriers limiting their dispersal. As a consequence, different regions of the globe are inhabited by different sets of living organisms.

In the mid-19th century ecologists recognised that the earth could be divided into different biogeographic regions. Alfred Russel Wallace (1823–1913) played a key role in defining and recognising biogeographic regions. He improved the existing maps of  biogeographic regions and provided basic rules to identify them. His observation that some of these regions are home to similar species, despite being far away from each other and separated by significant barriers was the inspiration for Alfred Wegener’s theory of continental drift. In more recent years regionalisation has been used to understand the spatial drivers of biological evolution and to protect those regions characterised by particularly unique flora and fauna.

The biogeographic regions identified by Alfred Russel Wallace from The Geographical Distribution of Animals (1876)

Despite the long history of biological regionalisation, the methods to identify biogeographic regions are still being improved. We are currently working in this exciting field of research and recently published ‘A new procedure for extrapolating turnover regionalization at mid-small spatial scales, tested on British butterflies’ in Methods in Ecology and Evolution. Continue reading “Biogeographic Regions: What Are They and What Can They Tell Us?”