Post provided by Rob Robinson
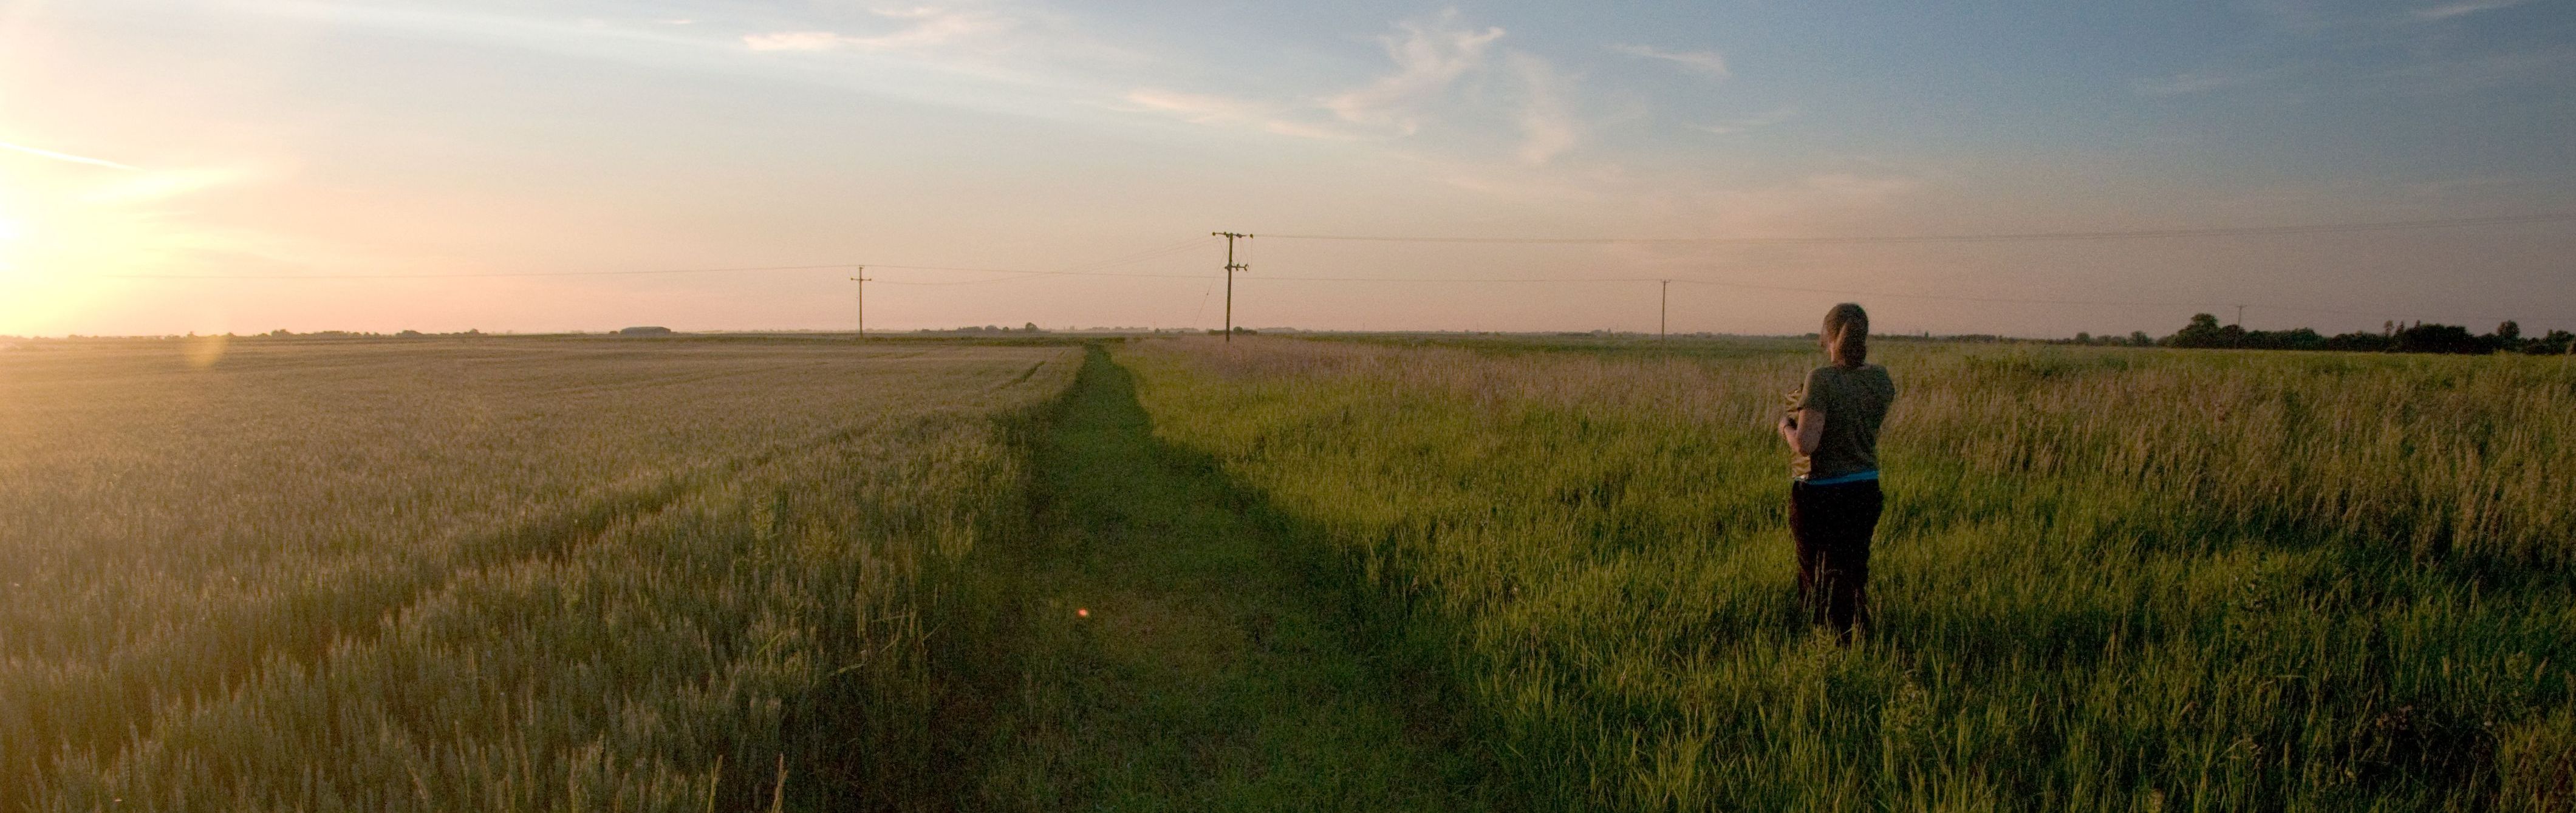
It’s 6am on a warm spring morning and I’m about to visit the second of my Breeding Bird Survey1 sites. Like 2,500 other volunteers in the UK, twice a year I get up early to record all the birds I see or hear on the two transects in my randomly selected 1km square. Each year I look forward to these mornings almost as much for the comparisons as the actual sightings. Will there be more or fewer sightings of our summer migrants this year? How will numbers in this rolling Norfolk farmland stack up against those I see in urban, central Norwich?
The importance of demography
But simply recording these changes is not enough; we need to understand why they occur if action is to be taken. This requires us to quantify the demographic rates (survival, productivity and movements) that underlie them, which in turn requires samples of marked individuals. Simply counting individuals is not enough.
A nice of example of this comes from the work of Michael Schaub and colleagues on a Swiss population of eagle owls (Bubo bubo) where individuals had been ringed for 20 years. Although the population was small, counts had suggested it was stable. However, modelling showed that frequent immigration was hiding massive mortality from individuals electrocuting themselves on the many electricity pylons in the area. This suggested an immediate – and practical – conservation action: better insulation on the pylons.

Back to Bayes: developing state-space models
We are fortunate that not only are there many highly-trained bird ringers with the necessary skills to catch often wary birds, there is also an active community developing methods to analyse the valuable data they collect. Much of this development can be traced through the series of Analytical Meetings instigated by the European Union of Bird Ringing (EURING); the latest of which featured in a Special Feature of Methods in Ecology & Evolution.
One area of current focus has been on the integration of datasets, in particular, the application of Bayesian thinking to create ‘state-space’ or ‘hidden-process’ models. These separate the underlying biological mechanisms (population dynamics) from the observations (counting and marking samples of individuals) allowing us to disentangle process variation (which usually is of interest) from sampling variation (which generally isn’t).
State-space models are revolutionising our understanding of how populations, from fish to sheep, work and how they can best be managed. Although a Bayesian approach isn’t necessarily required (frequentist techniques, such as the ‘Kalman filter’, can be used), the Bayesian’s focus on distributions and use of numerical sampling algorithms does make them easier to construct and fit. This is further aided by availability of relatively user-friendly packages, such as BUGS, JAGS and Stan (all with bridge packages allowing access through R), together with books aimed at ecologists, such as those of Kéry & Schaub or Hobbs & Hooten, which explain the principles lucidly.
Bringing the data together
In Britain, the ongoing efforts of thousands of volunteers (including me!) contribute to the BTO’s Integrated Population Monitoring Program (further information in this article). This has three components: the Breeding Bird Survey provides data on abundance, the Ringing Scheme on survival, and Nest Record Scheme on productivity. Results of all three are summarised annually and contribute to national biodiversity statistics. These data have been brought together in an integrated analysis characterising the population changes of 17 bird species over a 45 year period.
A nice feature of the integrated approach is that one can quantify things that haven’t been measured. In bird populations, for example, we often lack data on the total number of breeding attempts or early juvenile survival. By analysing the multiple datasets in an integrated way we can at least assess how important such omissions are. Our results showed that, in most cases, the contribution of these to annual variation in abundance was small. Thus, even relatively unstructured demographic monitoring is still able to account for most of the variation in population indices based on well-structured data. Further, they suggested among declining species recruitment (that is, the number of chicks that survive to become breeding adults) is generally the most important influence on variation in population change, whilst in those with increasing populations, adult survival appears more important. This indicates different management approaches may be required.

We looked in detail at changes in numbers of lapwing (Vanellus vanellus), a charismatic wader that used to breed over much of lowland Britain, but whose numbers have declined alarmingly. The major period of decline coincided with a series of cold winters during which chances of survival were greatly reduced – average life expectancy decreased from 8.6 years to only 5.3 years. Although survival rates quickly recovered subsequently, lapwing abundance did not. This was because, in the interim, nest survival probabilities had decreased, consequently recruitment was not high enough to allow the population to recover from an external, and unpredictable, shock (those cold winters). By degrading habitats (in this case for nesting), we are increasing the vulnerability of populations to such chance events, even though population level impacts may not immediately be apparent (in the years prior to the decline, lapwings experienced years of low nest success, but no decrease in population).

Why does this matter?
The depressing status of global biodiversity today is well known, with governments around the world pledging (with varying degrees of legal seriousness) to reverse species declines by some year, usually in the middle-distance. In Britain (and many other countries), they do this because people care about wildlife in general, and about birds in particular. The leading conservation advocacy organisations in the UK (National Trust, RSPB, The Wildlife Trusts), each have more members than all of our political parties combined (even allowing for the recent surge in membership of the Labour Party). Increasingly, conservation targets are phrased in generic terms, such as “restoring landscapes” or “ecosystem health”. Ultimately, though, these require an understanding of the drivers of individual species change if they are to be delivered effectively, so collecting data on the underlying demographic mechanisms is critical. Indeed, comparing demographic changes across multiple species can help identify wider environmental issues. For example, declines in survival of most farmland seed-eating birds signalled the biodiversity consequences of changes in crop rotations and increased homogenisation of farming practices in western Europe.

Monitoring also matters because it engages people with changes happening in their immediate environment. Simple gathering and tracking of opportunistic records, though, will rarely be sufficient. Whilst ‘occupancy’ methods, which separate models of underlying biological distribution from the process of detecting species’ presence (and, importantly, absence) can help – and there is much activity around the development of these methods – surveys designed around structured sampling will ultimately be more efficient. Survey protocols, though, need to balance rigour and usability, requiring continued dialogue between the ecological and statistical communities. With appropriate explanation of the benefits of the design, and feedback of results, people will participate, as has been clearly demonstrated by the Breeding Bird Survey and the newly established National Plant Monitoring Scheme. By focussing their effort, participants gain a greater appreciation of the changes occurring in their environment and a reason to engage in positively contributing to its management, whether that is through local action or participation in a broader national debate.
The outlook for ecological monitoring
Monitoring, in the UK at least, is a three-way partnership. Firstly, between the organisations (BTO and others) running the surveys and the volunteers participating in them who freely give their time (and money) to support them. Secondly, and critically, between these organisations and the Joint Nature Conservation Committee, the public body that advises on UK-wide and international nature conservation issues, and which is a key supporter of many of the schemes. The long-term partnership between BTO and JNCC, in particular, has been extremely productive, leveraging volunteer effort worth approximately £30M in 2014. At a time when individual agencies have tended to cut their spending on ecological monitoring jeopardising valuable long-term datasets, the long-term planning facilitated by the Partnership enables consistent data-gathering that many shorter-term research projects benefit from. The key challenges will be maintaining this consistent funding stream; gathering more structured data that can be linked to environmental data gathered at similar scales; effectively harnessing the increasing power of mobile technology; and further developing the analytical methods to make most efficient use of the millions of records collected by citizen scientists around the globe.
Oh, and that farmland square I get up early to survey? It has fewer birds than my city centre transect, every time…
1 The BBS is funded by BTO, RSPB and JNCC (on behalf of Natural England, Natural Resources Wales, Scottish Natural Heritage and the Dept of the Environment in Northern Ireland); the Nest Record Scheme by BTO and JNCC; the Ringing Scheme by BTO, JNCC, National Parks and Wildlife Service in Ireland and the ringers themselves.
To find out more about using data gathered by volunteers, read ‘Integrating demographic data: towards a framework for monitoring wildlife populations at large spatial scales‘ by Robert A. Robinson et al. This paper part of our Wildlife Monitoring Virtual Issue. It was also a part of our Special Feature on ‘Modelling Demographic Processes in Marked Populations: Proceedings of the EURING 2013 Analytical Meeting‘.

2 thoughts on “Making the Most of Volunteer Data: Counting the birds and more…”