Post provided by FRANCES E. BUDERMAN
Animal Movement
Animal movement is a driving factor underlying many ecological processes including disease transmission, extinction risk and range shifts. Understanding why, when and how animals traverse a landscape can provide much needed information for landscape-level conservation and management practices.
The theoretical underpinnings for modelling animal movement were developed about seventy years ago. Technological developments followed, with radio-collars initially deployed on large mammals such as grizzly bears and elk. We can now monitor animal movement of a wide variety of species, including those as small as a honeybee, at an unprecedented temporal and spatial scale.
However, location-based data sets are often time consuming and costly to collect. For many species, especially those that are rare and elusive, pre-existing data sets may be the only viable data source to inform management decisions.
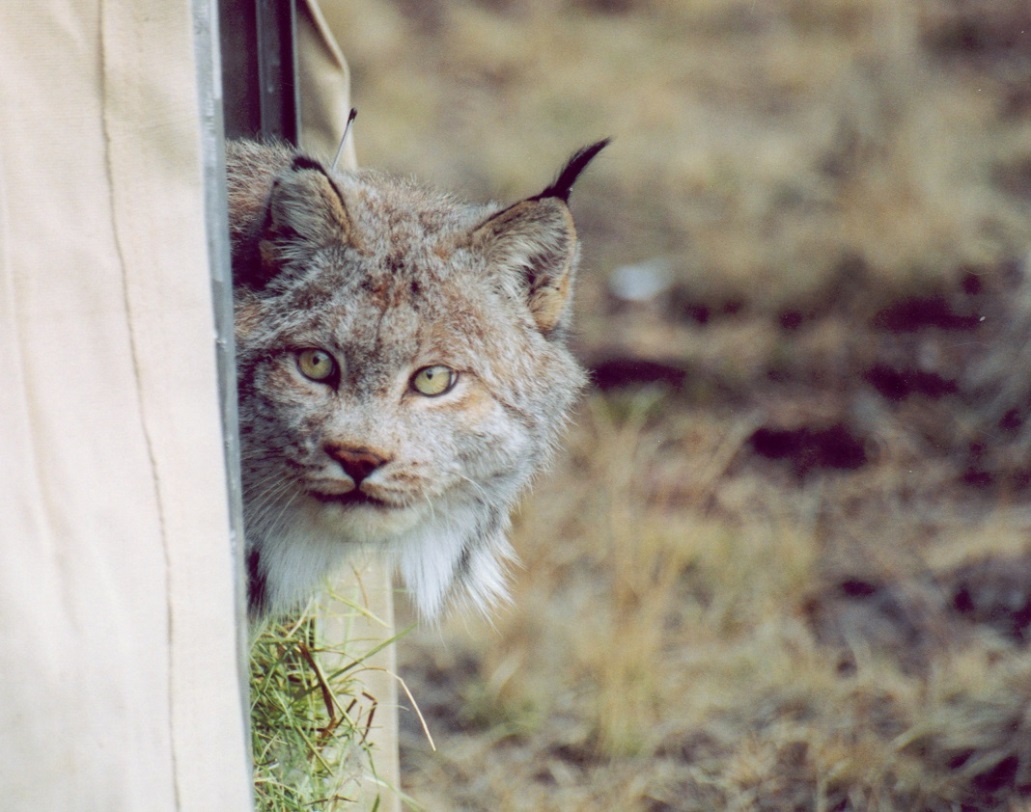
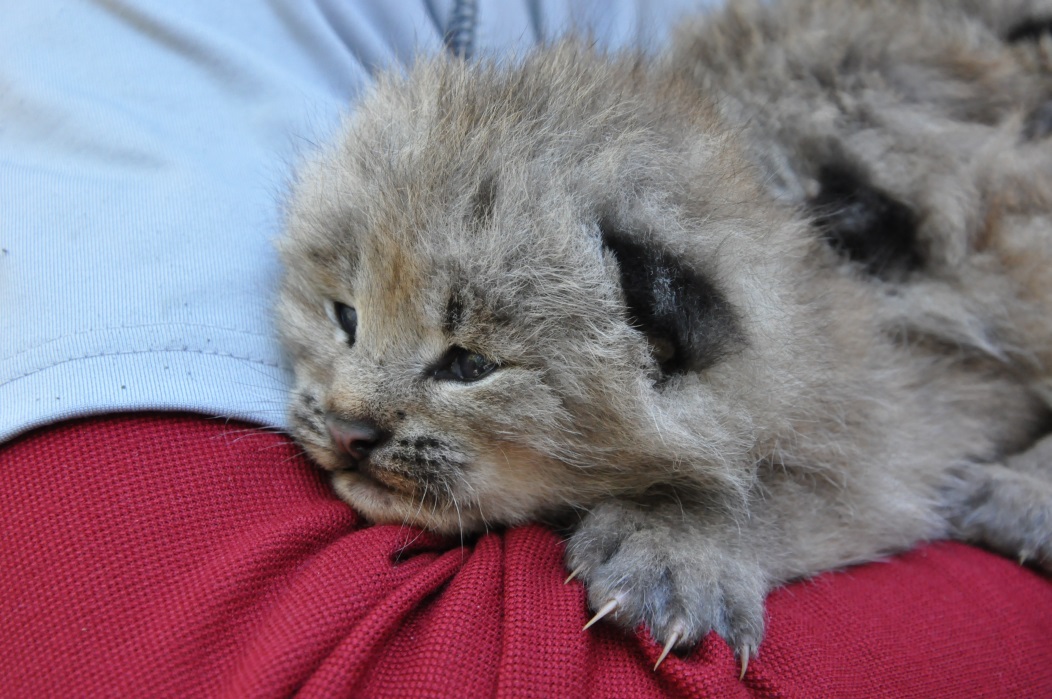
Canada Lynx Reintroduction
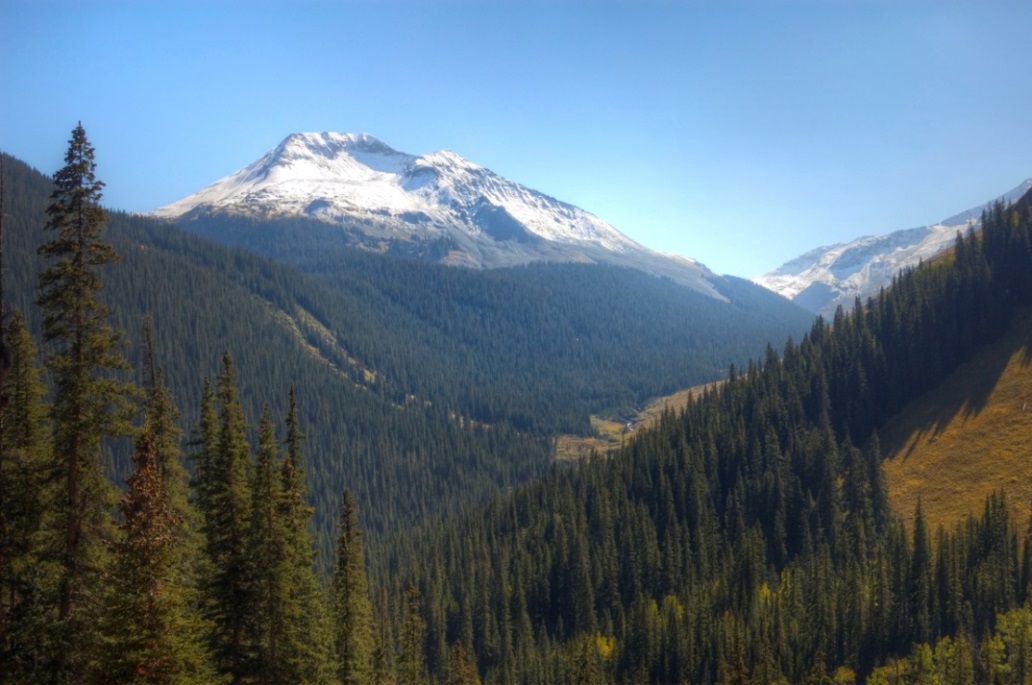
The Canada lynx population in Colorado was eradicated in the 1970s due to predator control activities and habitat loss. In 1999, Colorado Parks and Wildlife initiated a reintroduction program. Over the next 7 years they released 218 wild-caught lynx from Canada and Alaska in the San Juan Mountains of southern Colorado.
Each individual was released with a VHF/Argos telemetry collar to monitor reproduction, survival and movement out of the reintroduction area. This monitoring showed us that the reintroduction was a success. However, Canada lynx are currently listed as endangered in Colorado and threatened in the US as a whole. In addition, Colorado is located at the southern tip of their historical range and data from northern populations may not apply to lynx in Colorado.
The location data associated with the reintroduction are temporally coarse (i.e. 1-2 weeks, depending on the data type), contain large measurement error, and consist of various combinations of VHF and Argos data. Attempts were made to locate each individual every two weeks, but logistical difficulties meant this wasn’t always possible. In addition, after an individual left the reintroduction area, the location data were solely provided by the Argos component of the collar (which turned on once a week for twelve hours). Due to the polar orbit of the Argos satellite, Argos data has an x-shaped error structure, and accuracy of both VHF and Argos data is significantly worse than GPS data.
Functional Movement Models
Many existing movement models were developed for data sets with a fine-scale temporal resolution (eg. on the order of hours), low measurement error or a single set of locations. These models are often called mechanistic, where the movement process is defined by a biological model with unknown parameters (such as speed, turning angle, or velocity) that are then estimated. However, the Canada lynx data were not collected for the purposes of movement modelling. This meant that using an existing movement model would be very difficult.
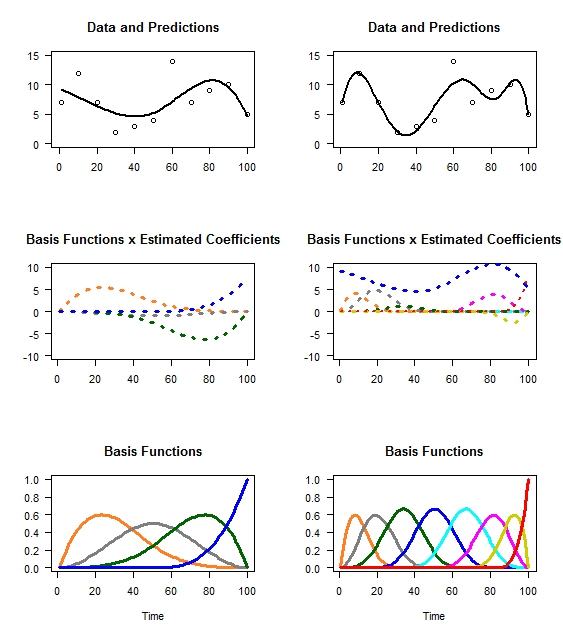
To deal with these difficulties, we developed a model that relies on a functional process approach. In functional data analysis, we assume that there is some unknown non-linear continuous function that gives rise to the data. For example, a quadratic function could describe the process underlying our data, but in functional data analysis, the function may be highly complex and have an unrecognizable form. To approximate this unknown function we use building blocks called basis functions. Any continuous function can be represented as a linear combination of basis functions. Ecologists may be most familiar with basis functions through their use in generalised additive models (GAMs).
In our article, A Functional Model for Characterizing Long-distance Movement Behaviour, we use the basis functions as covariates to directly approximate the function. Movement at different temporal scales can be modelled using multiple sets of basis functions that vary in their frequency. As the number of basis functions increases, finer scale changes in the process can be detected. However, as a side effect you increase the degree of collinearity between nearby basis functions. Therefore, we use regularization to shrink the coefficients of the less important basis functions toward zero.
Our process model is simpler than it seems (as you will see in our article) and can be written as a linear regression, where the covariates are the values of the basis functions at a given point and the coefficients are the contribution of that basis function. This parameterization is computationally fast and flexible. It also allows us to predict the movement path at any temporal scale.
Accounting for Measurement Error
Multi-data source models, sometimes called integrated population models, exploit the fact that data collected in different ways, or on different aspects of a population, are generated by the same underlying process. In our case, animal movement gave rise to two types of location data with different error properties, leading us to model the VHF and Argos data as coming from two different distributions. The Argos data were modelled as a mixture of two distributions, in which an indicator variable determined the distribution that gave rise to a particular data point. This mixture distribution allowed us to account for the x-shape in the Argos error structure that we mentioned earlier.
Inference on Animal Movement
A useful property of Markov Chain Monte Carlo (MCMC) is that any function of a random variable is itself a random variable. This property allows us to derive quantities (such as heading or velocity) that are functions of the movement path as well as their associated uncertainty. For example, speed is a function of the location of an individual at t and time t+1. Because we have estimated a complete movement path, we can calculate an individual’s speed at any point in time.
In addition to speed, we can use residence time and turning angle as metrics to describe animal movement (in fact, they are the same quantities often estimated by mechanistic movement models). In fact, any quantity that is a function of an animal’s location through time can be derived. We can visualize these quantities and their uncertainty over space or time, allowing us to see where an individual lynx moved and the values of the quantities at that time.
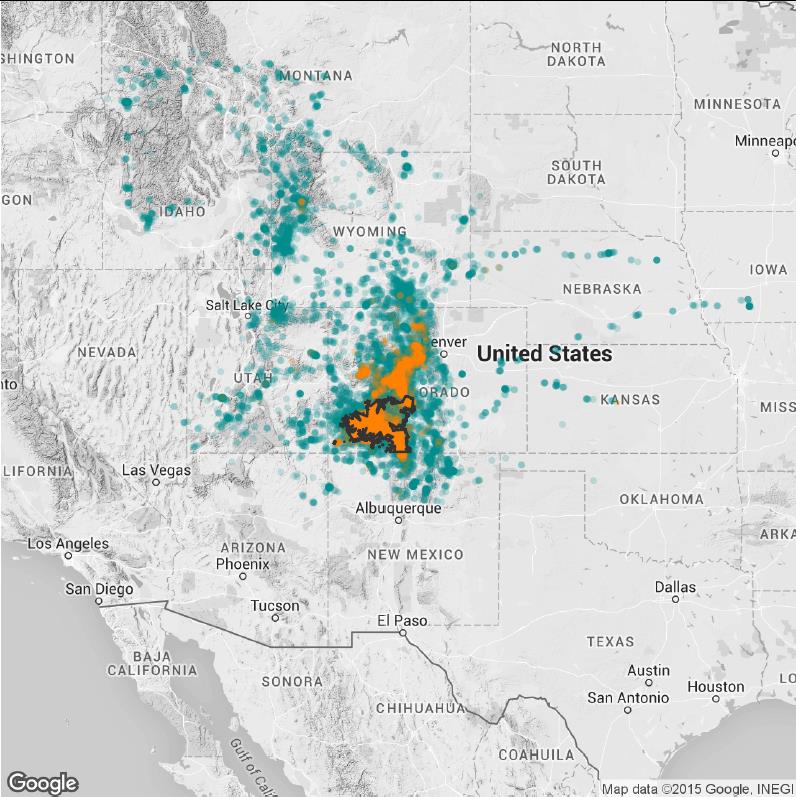
Population Level Canada Lynx Movement Behavior
We have conducted a population level movement analysis (it’s currently in review, but keep an eye out for it) where we incorporate multiple individuals into the functional movement model and summarize lynx movement behavior across the population. This new work will significantly contribute to the existing information on Canada lynx in southern boreal forests, specifically Colorado.
Our functional movement model isn’t limited to modelling Canada lynx movement, or even movements of other reintroduced individuals. It’s a flexible, fast and easy to implement method that can be used on any telemetry data set with locations that are irregular in time, temporally coarse or have large measurement error. To learn more about our approach, read our Methods in Ecology and Evolution article A Functional Model for Characterizing Long-distance Movement Behaviour.

Good review of this study Franny. Plus, it is really nice to hear about a wildlife success story for a change.