Post provided by Rasmus Ejrnæs, Ane Kirstine Brunbjerg & Hans Henrik Bruun
Local communities and regional biotas are built of hundreds, if not thousands, of species. Most of these species are small-bodied and discreet lifeforms. So it’s no wonder that naturalists have almost always focused their attention on conspicuous species of their particular liking. Why plants then? Well, plants are practical and efficient. They “stand still and wait to be counted”, as the eminent population biologist John Harper put it. No matter the weather, from spring to autumn. There are enough plant species to show contrasts between sites, and yet they can usually be identified to species level in the field.
You Can’t Predict the Diversity of Beetles from Lichens… Can You?
Unfortunately, the overwhelming scientific consensus seems to be that any particular taxonomic group won’t adequately represent the biodiversity of other taxonomic groups. The idea of surrogacy seems to hit the same hard wall as most attempts to provide generally working models for variation in biodiversity at local and regional scales. Biodiversity remains one of the largest scientific research questions without good general answers.
The journey of this paper started, when good research colleagues approached us, asking whether the Danish National Monitoring Program (NOVANA) provided reliable biodiversity assessments, in light of the strong emphasis on recording of vascular plants. We felt troubled. Perhaps because we’re vegetation ecologists by training, we quietly insisted, that plants aren’t so bad and that there’s a lot they can tell us. But it was quite obvious that we needed better evidence.
In our recent Methods in Ecology and Evolution paper, we present that evidence and show vascular plant species richness and bioindication can predict multi-taxon species richness.
Plant Species as Indicators
Most habitat mapping and nature monitoring worldwide is based on vascular plants – as is the Danish monitoring program. But there are few, if any, tests of the prediction of fungal and invertebrate diversity from recordings of vascular plants.
From a food web perspective, the idea of using plants as indicators sounds pretty good. Plants provide food for all the consumer species, from herbivores and decomposers to parasites and carnivores. As Hutchinson said, “The extraordinary diversity of the terrestrial fauna, which is much greater than that of the marine fauna, is clearly due largely to the diversity provided by terrestrial plants.”
Many vertebrate species are generalist consumers, but specialisation for specific sources of organic carbon is common among fungi and invertebrates. These carbon sources could be peculiar substrates such as dead wood, dung or animal carcasses, but sometimes they’re particular plant species serving as host to symbiotic or parasitic fungi and to herbivorous insects. Not all specialist insects are obligate feeders on a single plant species – for example, it’s common for butterfly larvae and bees to feed on plants from a selected genus or a family. So good old niche-differentiation could be an obvious reason for a high indicator value of vascular plants: If there are many plant species, there are opportunities for many specialist consumer species.
But what about the large number of generalist consumer species such as ground beetles, spiders and most saprotrophic fungi? Why would they care about the richness of vascular plants?
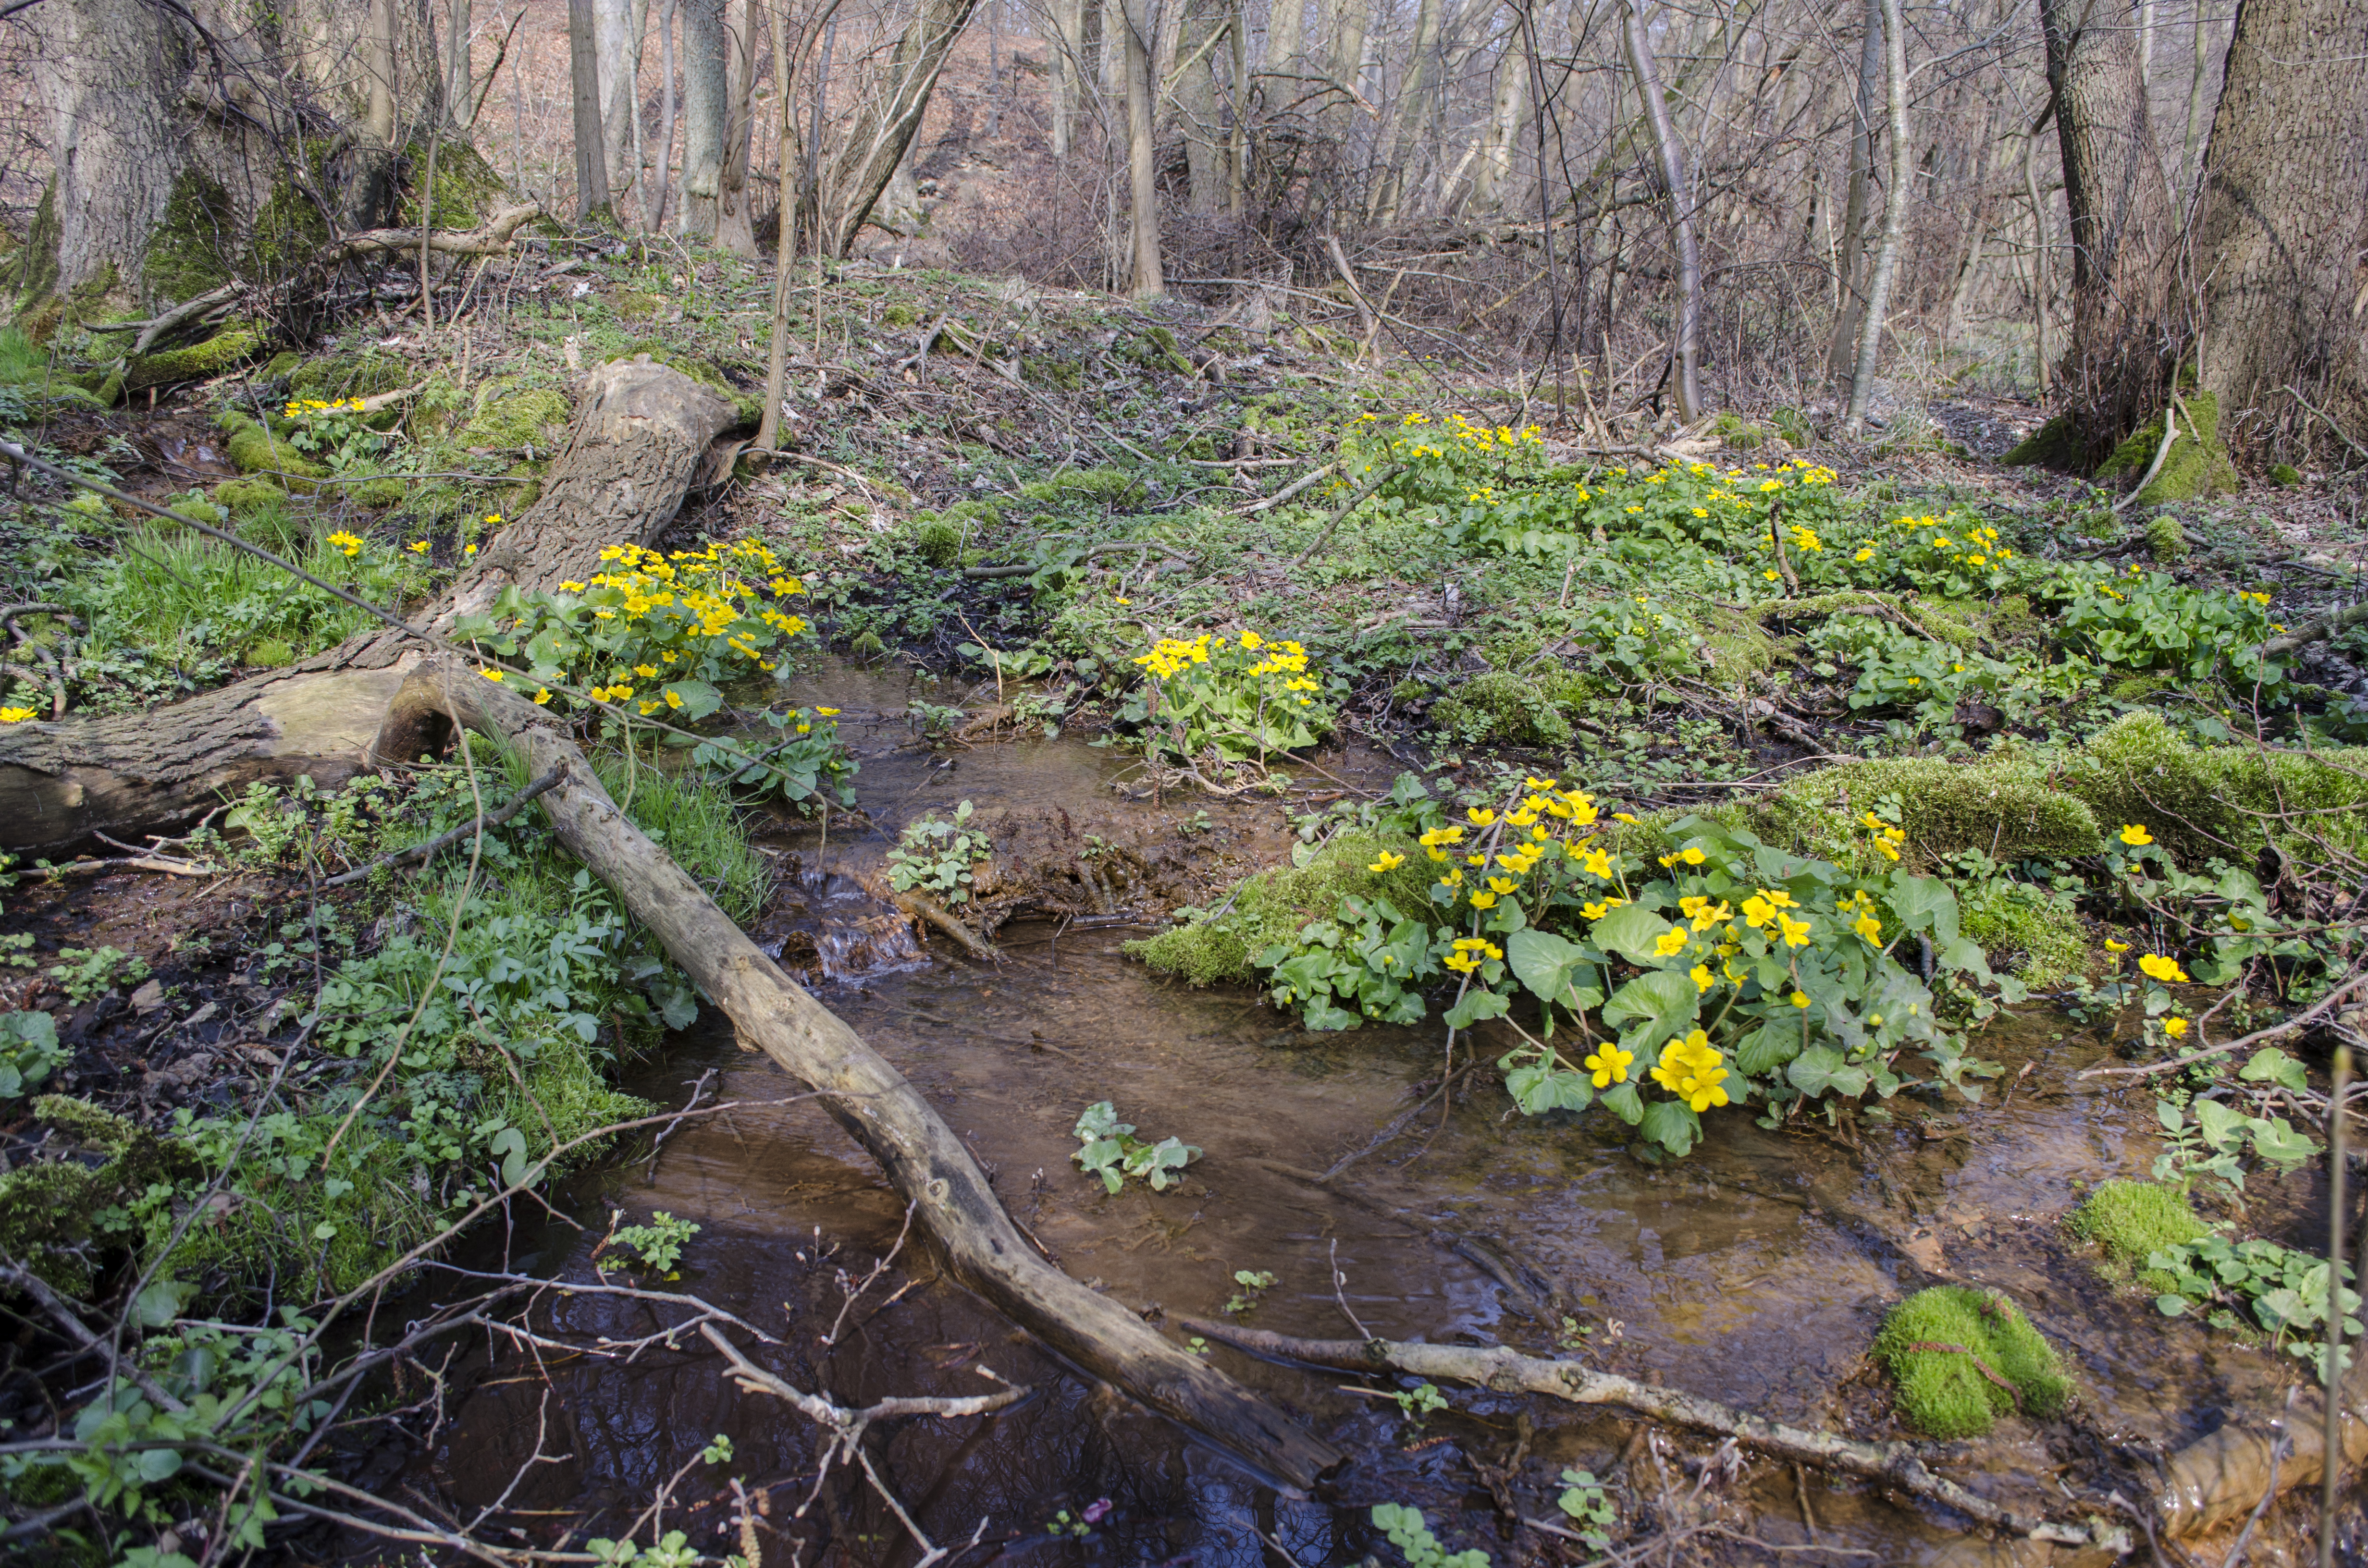
We hypothesized that vascular plants not only tell us about the number of niches available for specialist consumers, but are also quite accurate indicators for the abiotic condition of their local habitat. A carefully collected plant list from a site will tell the skilled field ecologist most of what she needs to know about soil moisture, nutrient availability and light conditions. Plants are sensitive to human cultivation of crops and timber too; they may even reveal human interventions from decades ago (sometimes even longer).
This whole way of thinking about plants as indicators was one of the corner stones in the concept of ecospace: a framework we previously proposed for understanding variation in biodiversity. Put shortly, we argued that biodiversity could be deduced from a mapping of abiotic position in environmental hyperspace (along gradients of fertility, soil moisture and pH, light etc.), biotic expansion of organic carbon sources (particularly plant species, but also dung and dead wood) and spatio-temporal continuity of the biotope. A careful mapping of vascular plants covers many of the relevant aspects of ecospace.
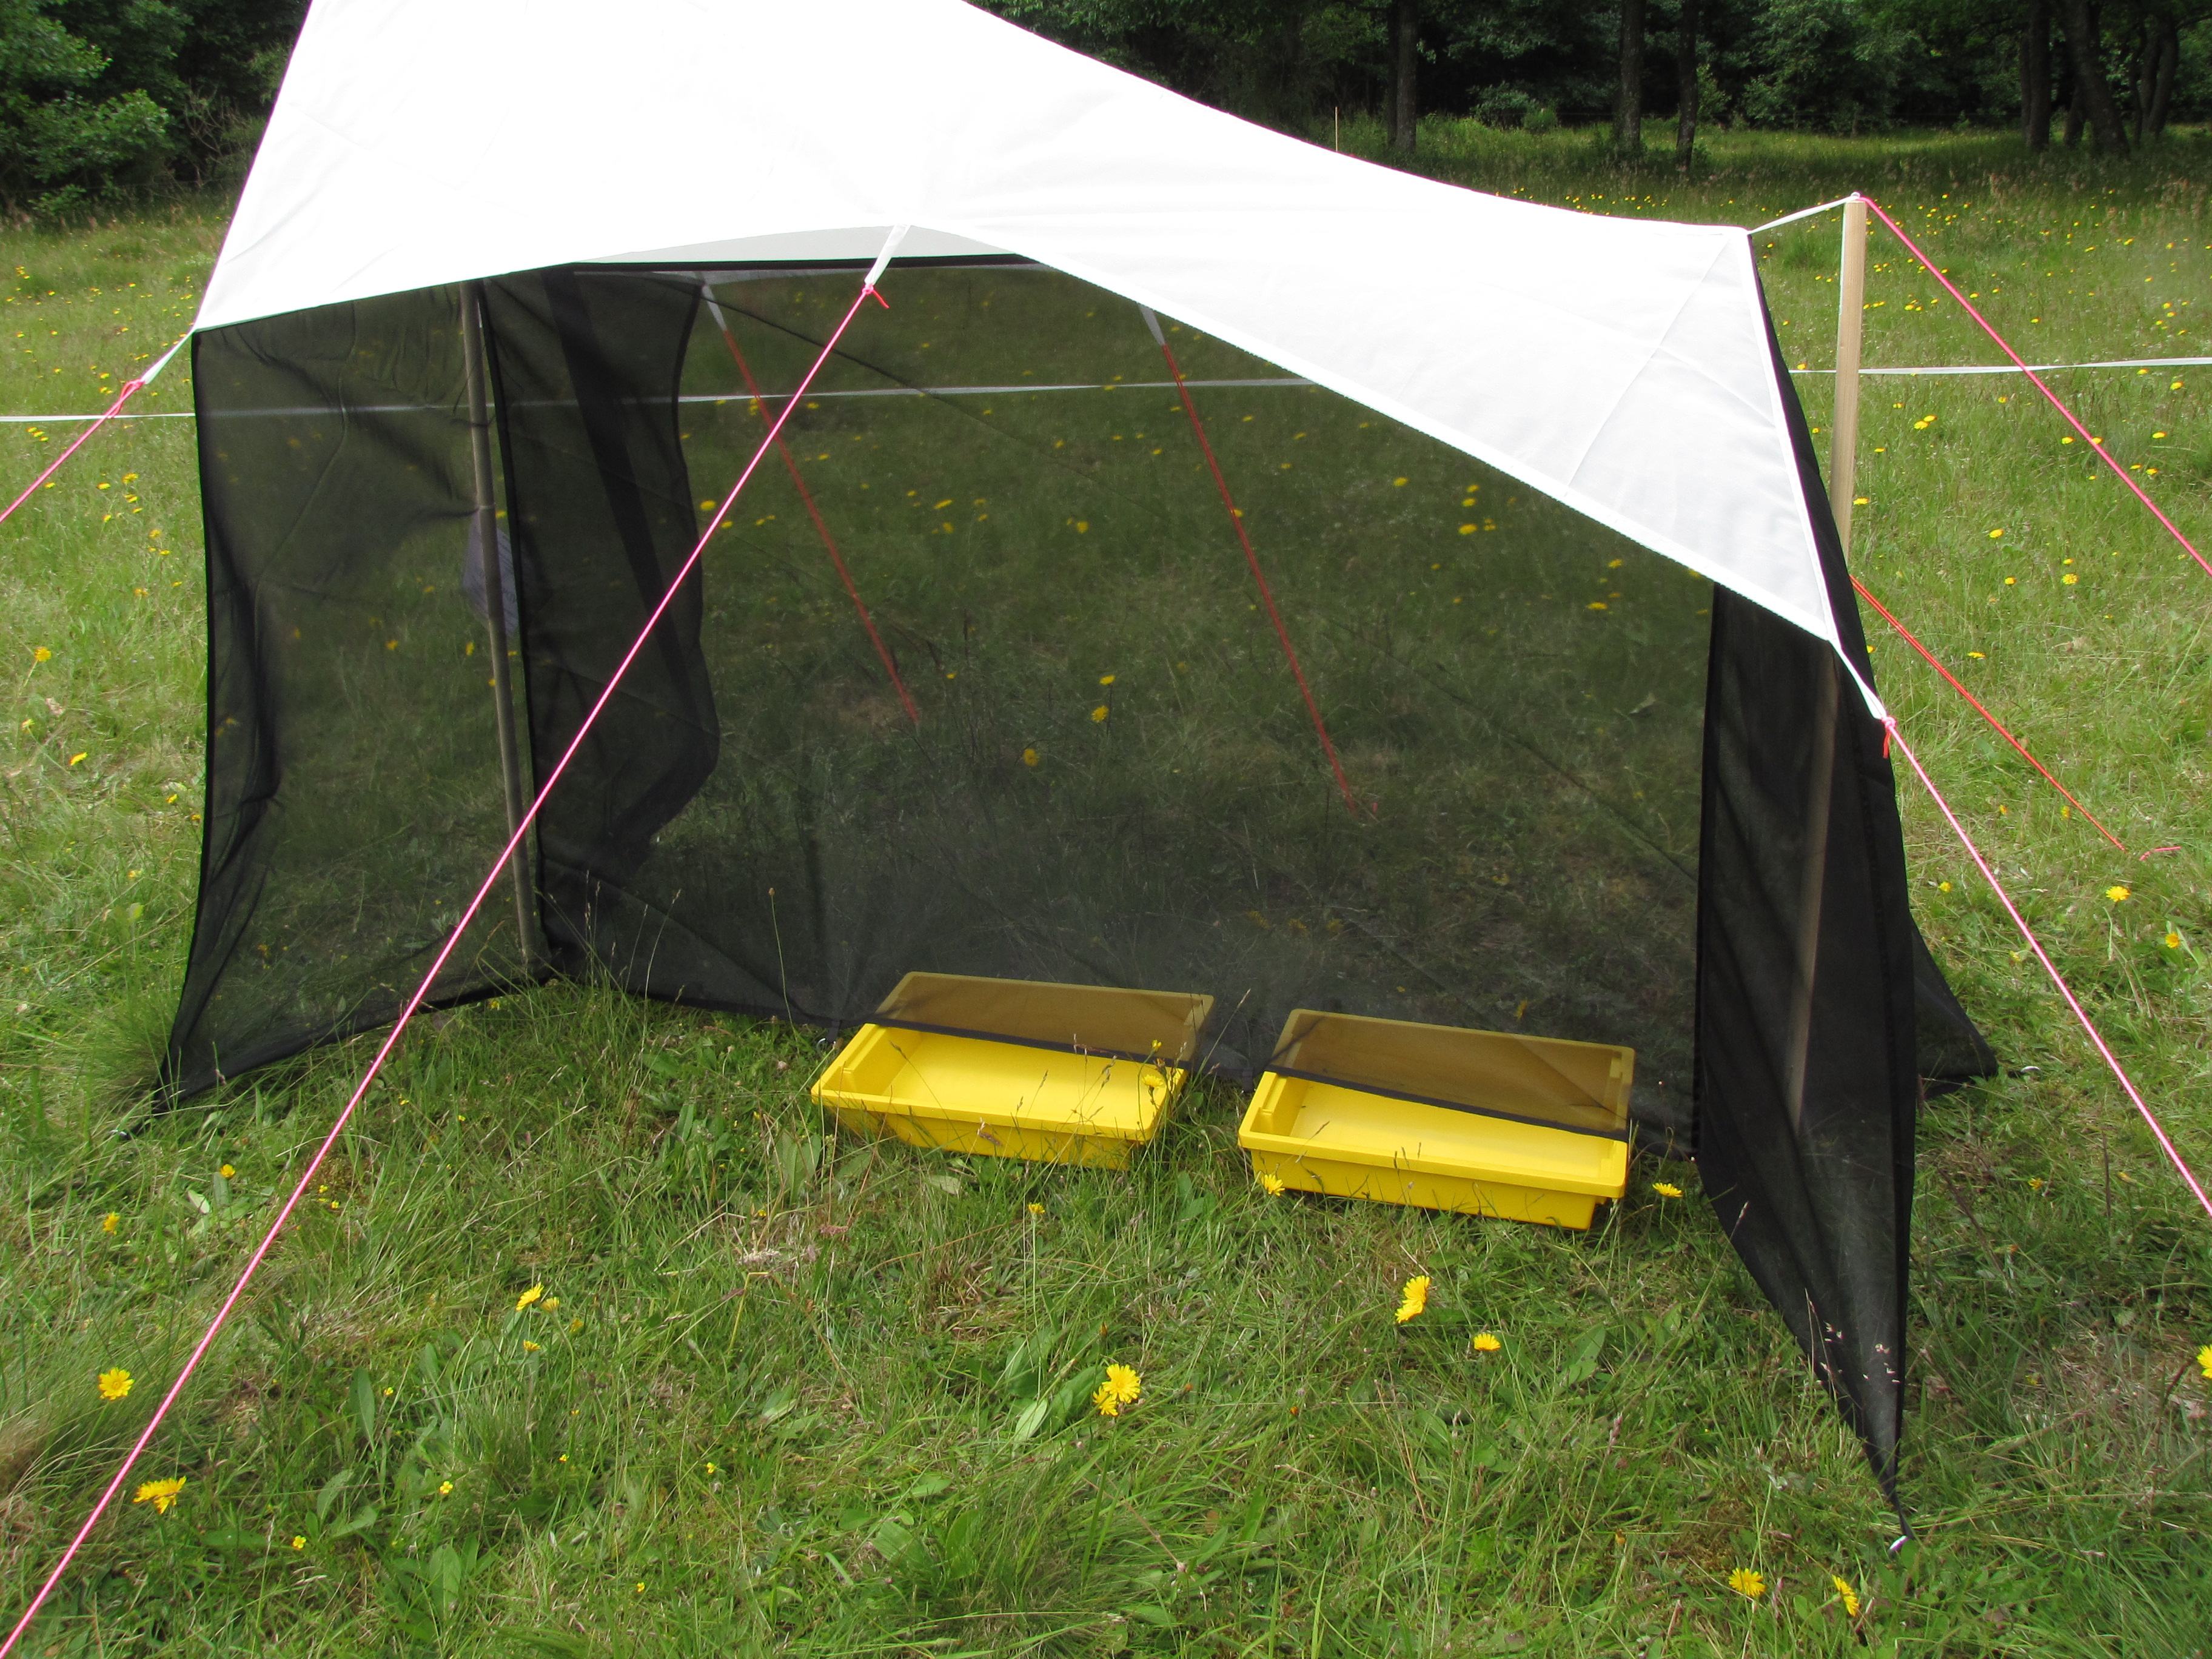
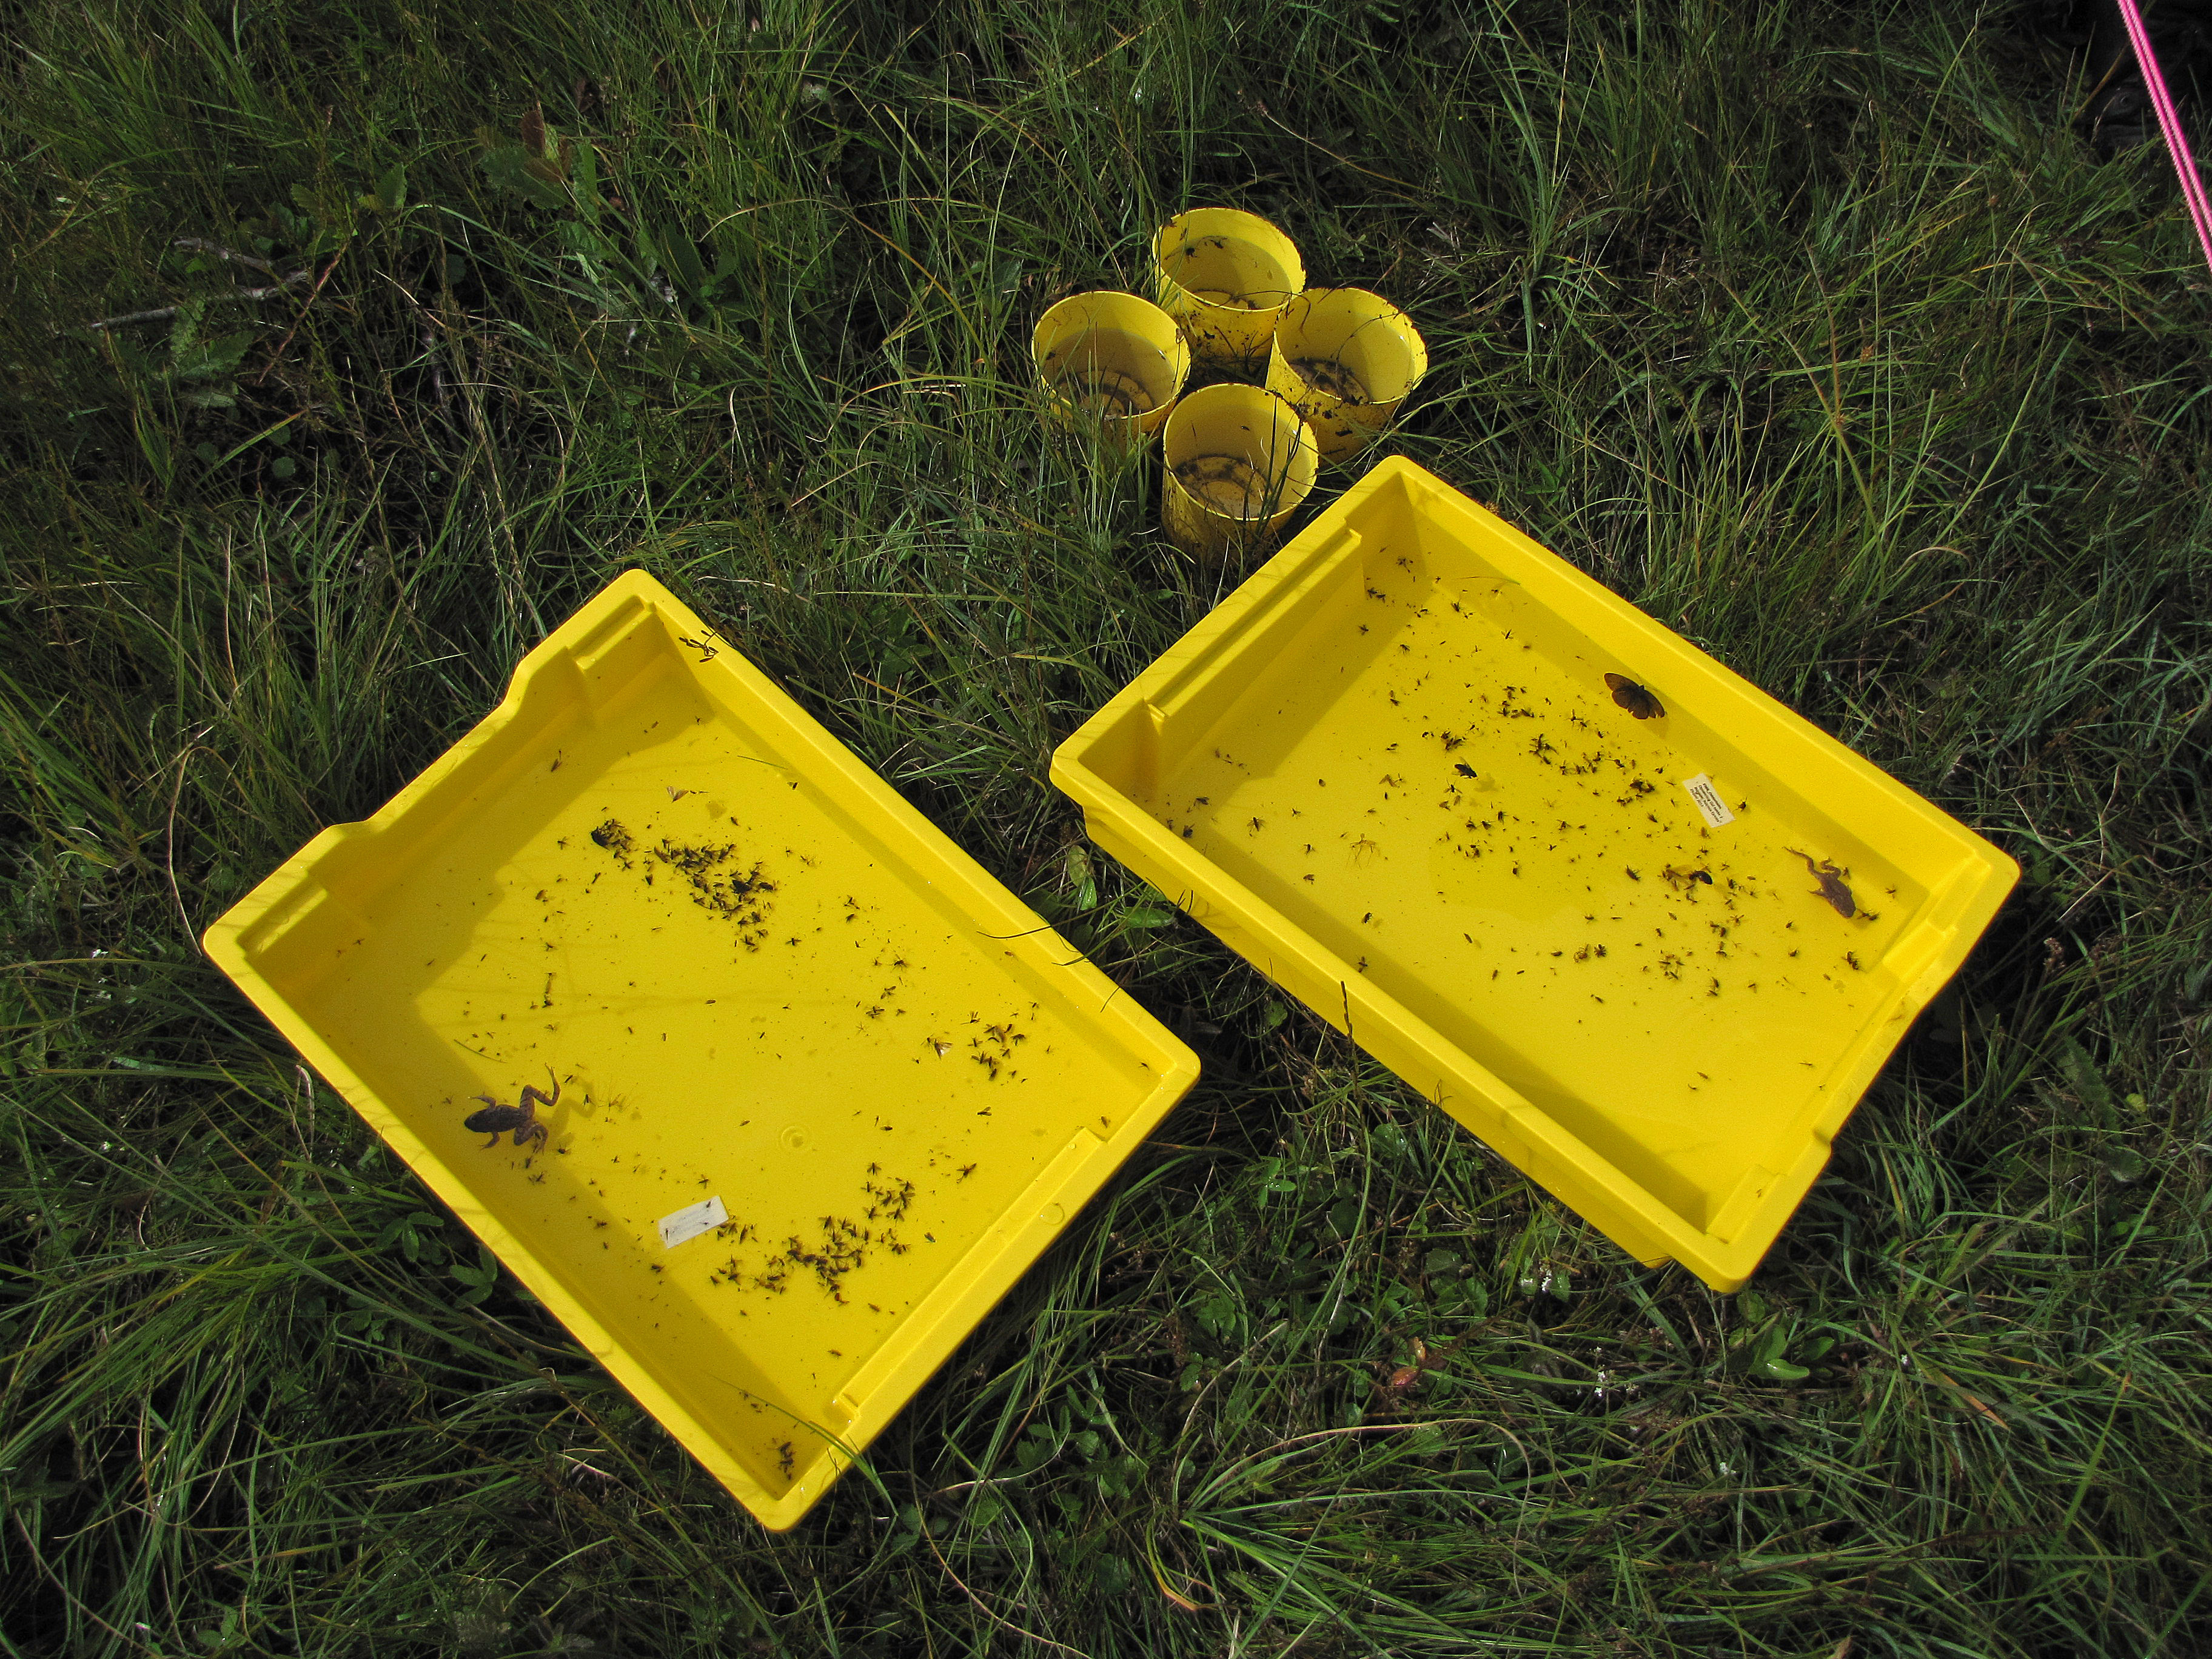
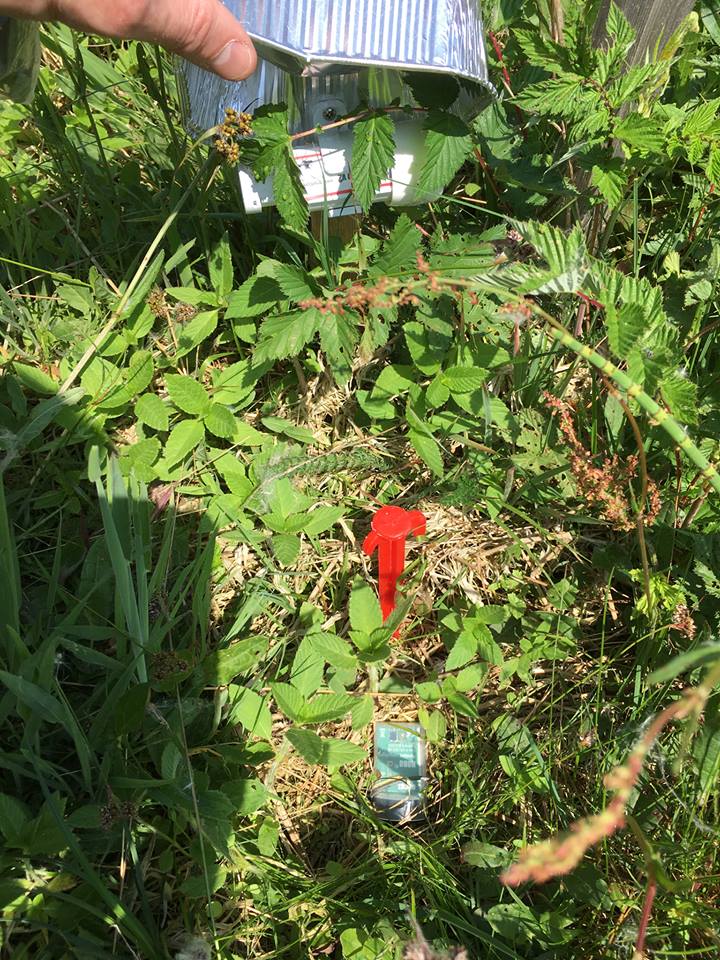
Testing the hypothesis of plants as proxys for wider biodiversity requires heaps of data. We got them from Biowide, a 4-year privately funded research project, enabling us to carry out a comprehensive mapping of terrestrial biodiversity in Denmark. We decided to work with sites of 40 × 40 m, acknowledging that these were too small to adequately represent vertebrate species, but large enough to represent vascular plants, mosses, lichens, macrofungi, gastropods, carabids, spiders, galling and mining arthropods and flying insects such as hoverflies, bees and wasps.
We stratified 130 sites to represent a variation of positions in abiotic space and carbon build up (18 types of natural habitats) and a variation in the intensity of human impact (3 types of fields and 3 types of plantations). Also, we allowed the community of natural historians to select 10 sites to represent perceived hotspots for biodiversity in Denmark. All sites were selected to be homogenous with respect to abiotic conditions, vegetation cover and density, and human impact.
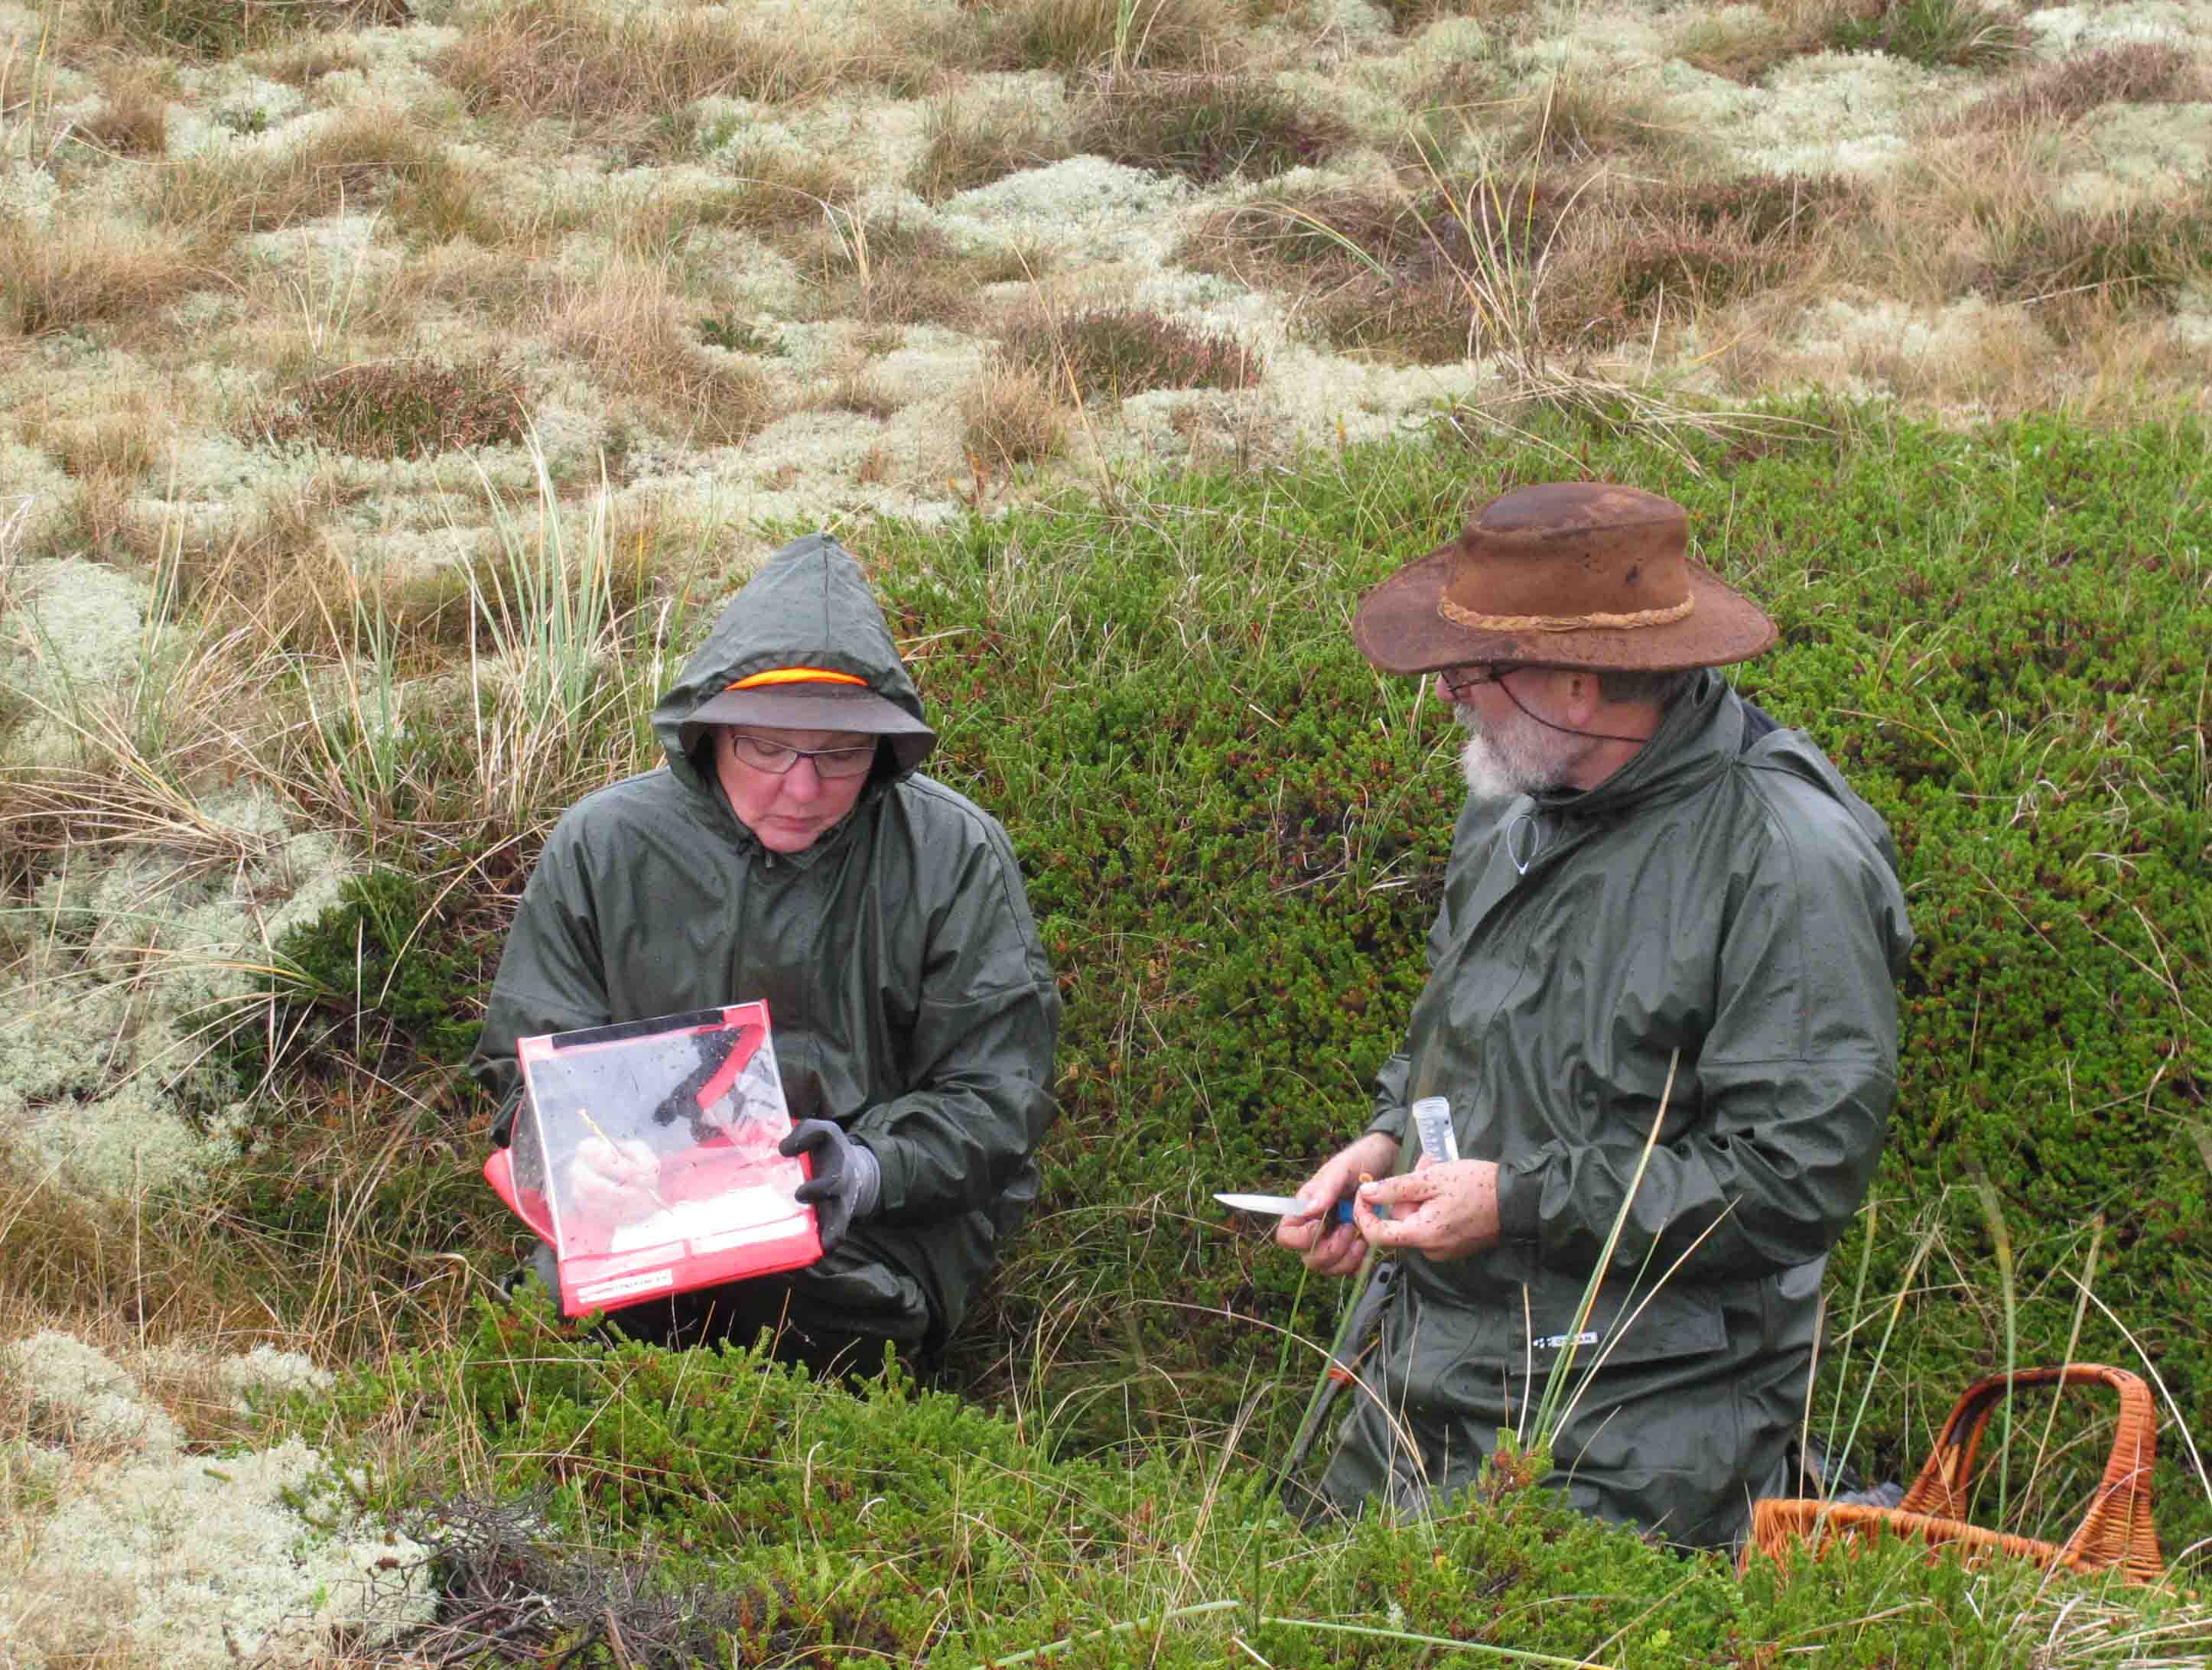
We completed a series of inventories with the help of professionals and expert amateurs. We don’t want to tire you with long account of the sorting, counting and lab identification of insects and macrofungi, but at the end of the day we had several comparable species data sets for all 130 sites.
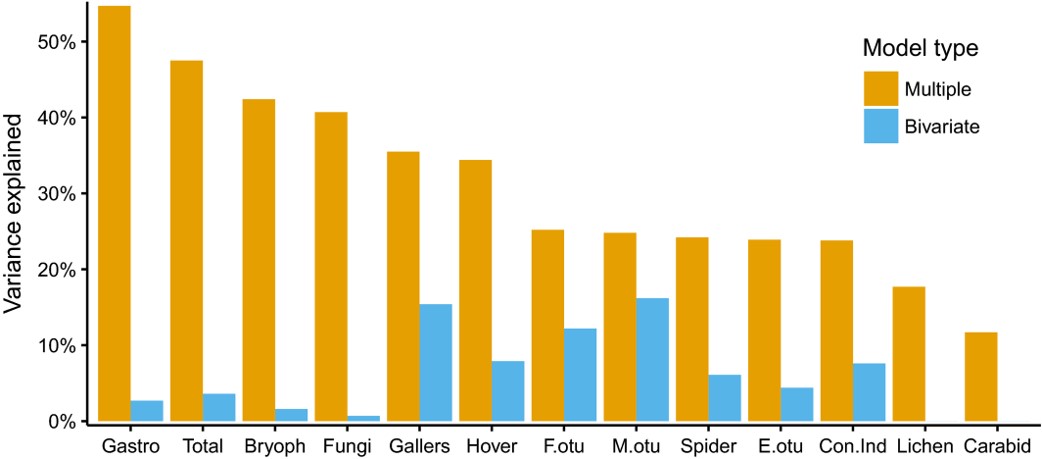
Loaded with data and a nice hypothesis we could get on investigating the richness patterns across the 130 sites. After reading the literature we weren’t completely expecting to find that plant richness alone was a reliable indicator for the richness of other groups, but were still a bit surprised by its poor performance. It was, for example, not even a significant predictor for bryophytes, lichens, fungi and carabids.
Things looked a bit more positive after we accounted for plant bioindication of the enormous habitat variation among our sites. Now plants could explain 12-55% of the variation in richness of other taxa and 48% of the summed richness of all other taxa than plants.
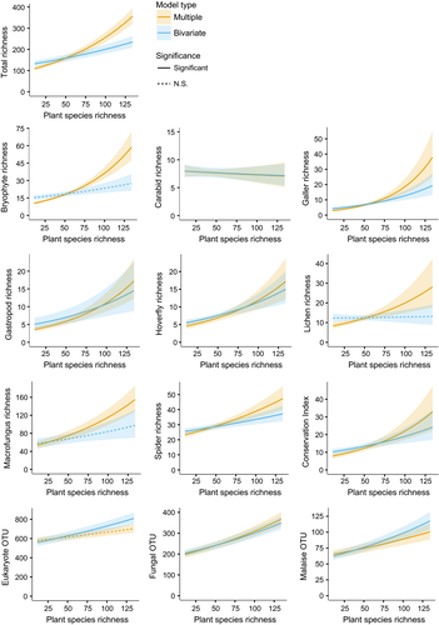
After accounting for environmental bioindication, vascular plant richness turned out to be an almost invariably positive and significant indicator of the richness of other taxa (except carabids and eukaryotic soil DNA). We see this as a general confirmation of the niche-differentiation hypothesis: a higher number of different plants also enables a higher number of consumers to co-occur in a biotope.
While our results are definitely good news for plant-based monitoring and conservation assessments, we have to give a bit of a disclaimer: Our results are only formally valid for temperate Europe and for our scale of study. It remains to be shown that plants can be used at larger scales such as landscapes or regions within continents. Oh, by the way, our study actually also revealed that plants were significant predictors of the occurrence of regionally red-listed species of other taxa – leaving the suggestion that vascular plants might be useful for the prediction of larger scale biodiversity as well.
From a basic scientific perspective, our results confirm that biodiversity produces more biodiversity. A higher number of vascular plants promotes the richness of other organism groups. But this effect is only revealed after taking environmental variation into account.
To find out more, read our Open Access Methods in Ecology and Evolution article ‘Vascular plant species richness and bioindication predict multi‐taxon species richness’

I find it fascinating how plants can serve as indicators for the diversity of other organisms.