Provided by Heini Kujala and José Lahoz-Monfort
Esta entrada de blog también está disponible en español
Spatial Conservation Planning and the Quest for Perfect Data
 Conservation planners and managers often need to make decisions with imperfect information. When deciding what action to take or how to divide resources between candidate locations, we rarely have all the information we’d like on what species are present at a site or which areas are most critical for supporting their population viability. A large volume of ecological research focuses on answering these very questions.
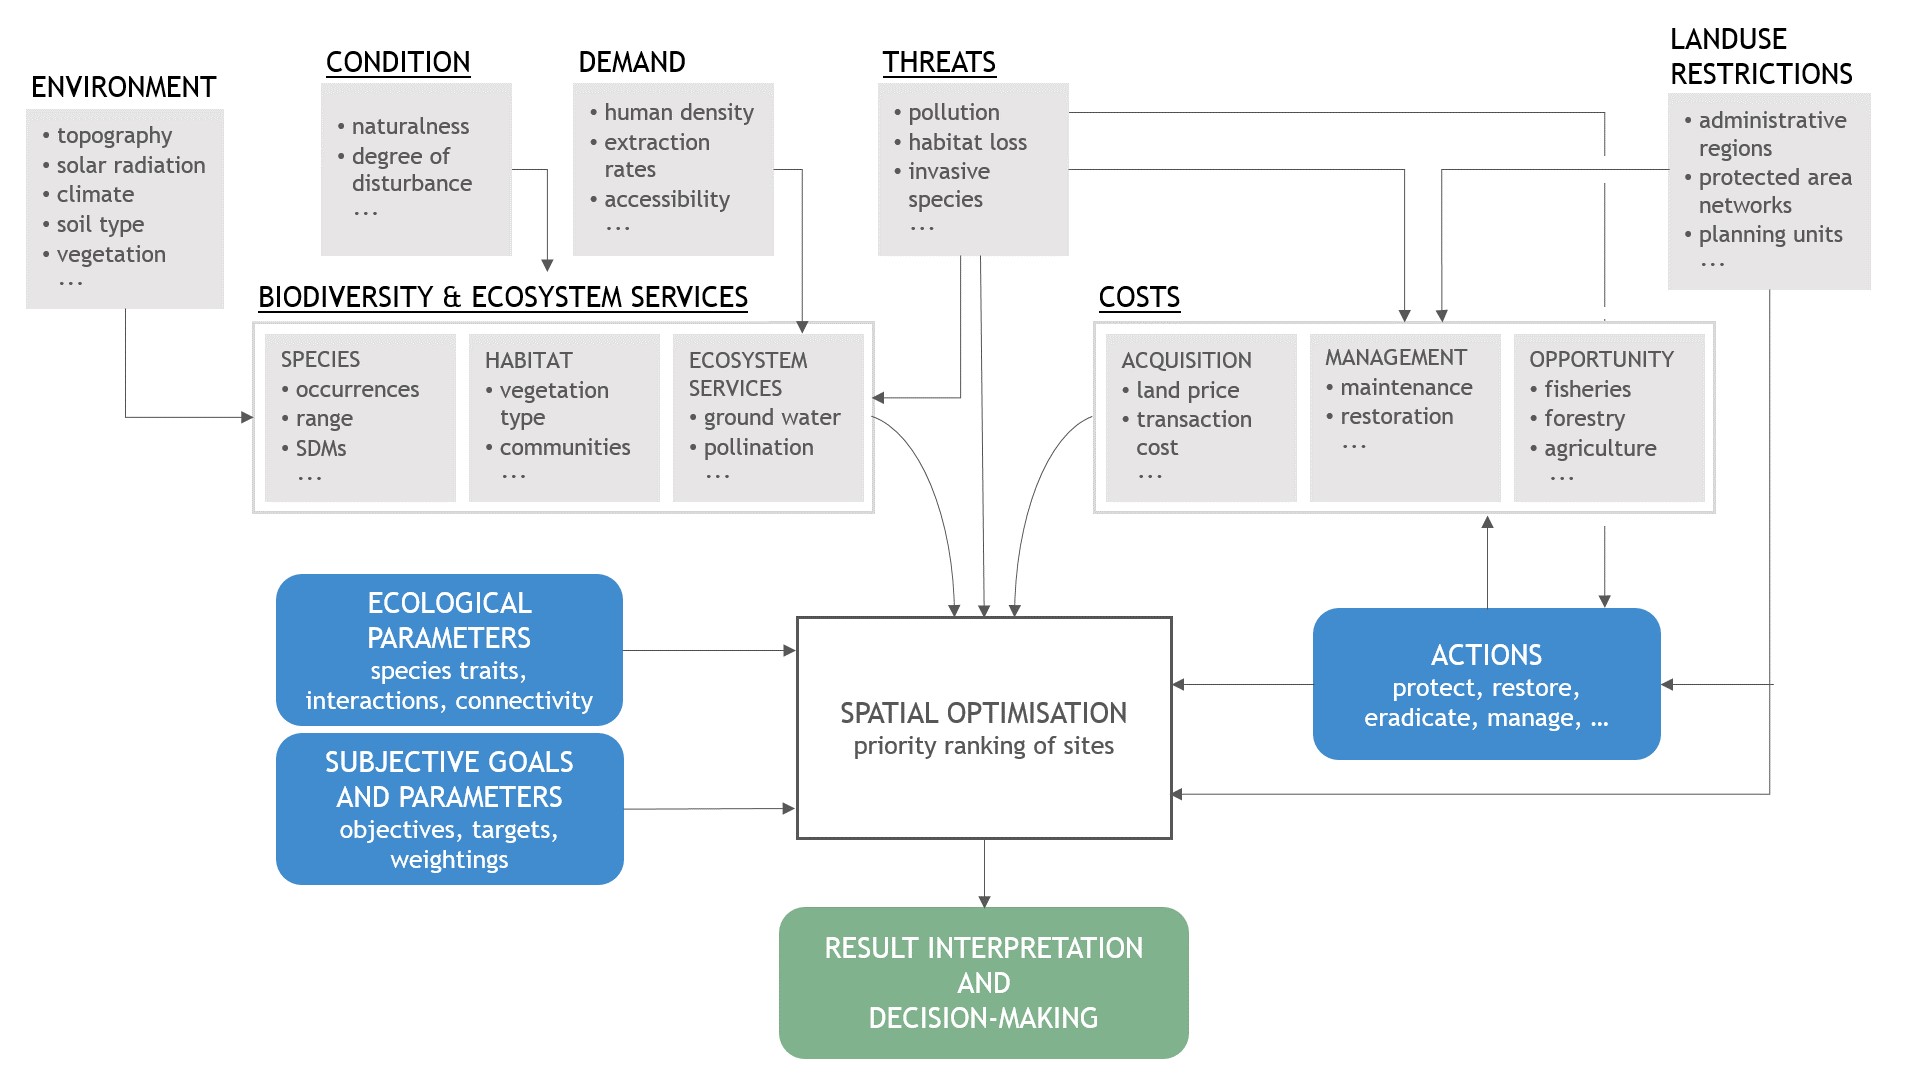
To make conservation decisions, we need other types of data as well. These include information on things like the cost of carrying out a given conservation action, current condition of sites, the distribution and intensity of threats in a region, and much more. Many conservation problems are spatial, meaning that we often need to decide between multiple candidate locations and that there are spatial dependencies between sites that need to be accounted for. All these different pieces of information are needed to make cost-efficient and effective conservation decisions.
Ecologists and conservation biologists are usually concerned about the completeness and accuracy of the ecological data used to make these decisions (understandably). But less effort has been spent in researching and verifying the accuracy of the types of data mentioned above. At the same time, we have relatively poor understanding of how data gaps influence solutions optimised across multiple species and locations, and the relative importance of gaps in different types of data. This is what we set out to find in ‘Not all data are equal: Influence of data type and amount in spatial conservation prioritisation’.
One way of understanding the relevance of uncertainty in different data types is to ask how much a spatial solution will change if something in a data layer of specific type is changed. If changes in a data layer don’t change our decision, then solving the uncertainty in it might not be worth the effort. But if changes in one data layer effectively dictate which conservation actions will be carried out, it’s more important that the data are as accurate as possible.
Using Maths to Figure Out How Priorities are Formed
So, how much does the (numerical) value of a site change when a single data layer of different types is changed? And how does this affect the conservation priority of the site? Here is a good place to note the difference between site value, calculated across the different data layers, and site priority, the relative urgency of acting in a location in comparison to all other candidate sites. Changes in site values do not necessarily lead into changes in site priorities.
We built a mathematical approach for estimating the expected change in site value and priority under different scenarios of data change (e.g. a new layer added, or an existing layer changed). It turns out that how much a data layer (and the uncertainty in it) influences the final solution is defined by a combination of things. These include:
- The type of change (e.g. new layer added or existing one changed)
- The type of data that is changed (whether the layer represents a biodiversity feature, costs, condition or a threat)
- The number of data layers of different types there are in the analysis
- How the different data layers are combined to calculate a single, numerical value, for a site
- The spatial correlation and distribution of values between the added/changed data layer and all other data layers already considered in the analysis
Type and Number of Data Layers are Big Drivers – But Not the Only Ones

Spatial conservation plans tend to use vastly different amounts of different data types. In the papers we reviewed, biodiversity was represented by ~740 biodiversity features (species, communities and vegetation types) on average. Much fewer data were used to characterise cost, condition or threat – typically 0-4 data layers each. In a typical spatial conservation planning, the benefits of a site are defined by the sum of biodiversity values in that location, and costs are used as a divider to calculate cost-benefit ratios.
Looking at the average numbers of data layers above, it quickly becomes clear that adding one more species layer to the hundreds of layers already present is likely to result in smaller change than if that same layer was used as a cost to divide the sum. This tells us that costs, threats and habitat condition may have an impact orders of magnitude greater than those of individual biodiversity feature layers. In the most drastic scenario, a single cost layer can define the solution.
![Illustration of the relative influence different data types have on site values (shown in numerical values) and site priority (shown in colours – blue = low, red = high) in spatial conservation plans. E[∆Vi] and O[∆Vi] show the expected and observed average change in site values, and ρ gives the Spearman rank correlation between the new and original site priorities.](https://methodsblog.com/wp-content/uploads/2018/11/figure-4.jpg)
Spatial correlation between the added data layer and those already in the analysis is another important driver of priorities. In his paper, ‘Assigning priority to environmental policy interventions in a heterogeneous world’, Paul Ferraro showed that costs tend to drive the relative priority ranking of candidate locations most when they correlate positively with biodiversity benefits, that is, when the most valuable sites for biodiversity are the most expensive to protect.
In ‘Not all data are equal: Influence of data type and amount in spatial conservation prioritisation’ we expanded our understanding of these relationships to include all major data types. For example, information on habitat condition influences the priority order of sites most when they are negatively correlated with benefits. We found that the effect of spatial correlation also depends on how values in a layer are distributed. If condition values are very even across landscape, they have less impact than when there is a large variation in condition between sites.
Putting Things in the Right Context – Ecological Data is not Irrelevant
Our work highlights the importance of having good spatial data on costs, condition and threats when making spatial conservation plans. Unfortunately, this is rarely the reality. Accurate information on these types of data is difficult to get, and they tend to change through time. It’s therefore important to be aware of their relatively large effect on spatial solutions and carefully explore the potential consequences of not getting these data right. This means testing the results with and without these components and conducting sensitivity analyses to get a sense of their effect.

We should note that in our simulations we used a so-called scoring method to define the priority of the sites. That means that the priority order of sites was defined by their site values. Most conservation plans today use more sophisticated methods, which usually incorporate additional constraints to the solutions. Spatial prioritisation software like Marxan and Zonation are good examples of these. Our findings are equally fundamental for understanding how solutions in these more complex prioritisations are formed, but you should be aware that these additional constraints will further influence the prioritisation process. Constraints set to species representation will likely increase the influence of at least some species data layers, depending on how they are distributed in space and how many of them are included in the analysis.
The main advantages of quantifying the role of data in spatial optimisations is that it makes the process more transparent and helps us understand when potential data gaps are most important to address.
To find out more, read our Open Access Methods in Ecology and Evolution article ‘Not all data are equal: Influence of data type and amount in spatial conservation prioritisation’

3 thoughts on “In Conservation Planning, Some Data are More Important Than Others”