Post provided by Tom August
Introduction to the Hackathon
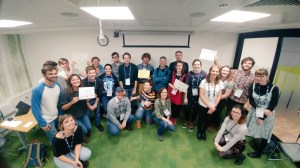
Hackathons have become a regular feature in the data-science world. Get a group of people with a shared interest together, give them data, food, and a limited amount of time and see what they can produce (often with prizes to be won). Translated into the world of academia as research hackathons, these events are a fantastic way to foster collaboration, interdisciplinary working and skills sharing.
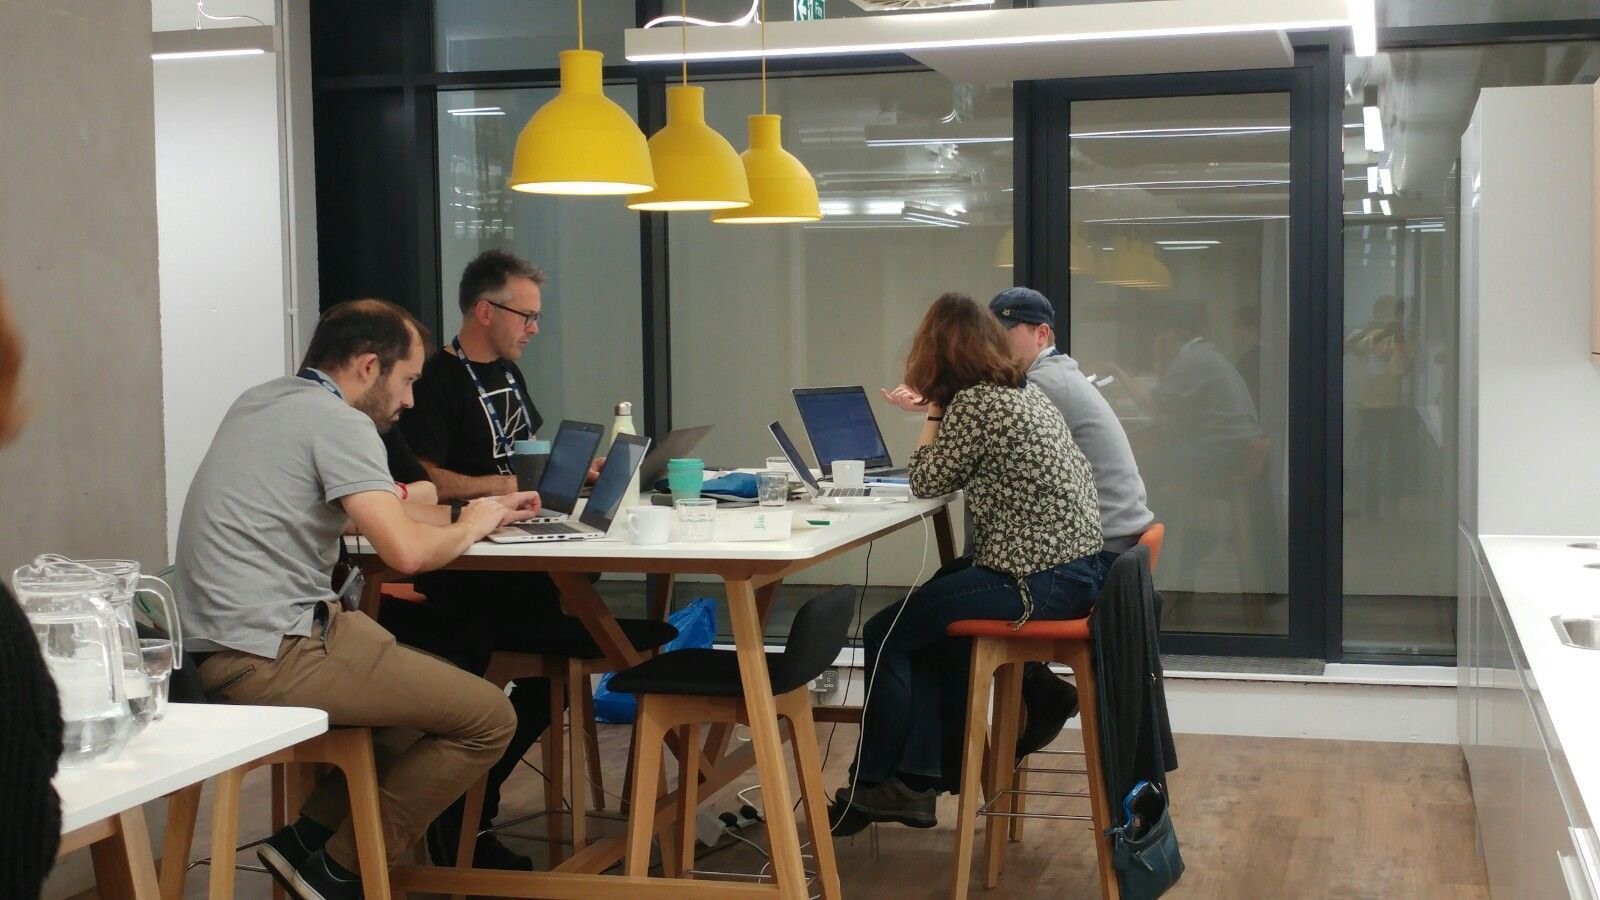
The Quantitative Ecology hackathon was an intense day of coding resulting in creative and innovative research ideas using social and ecological data. Teams worked through the day to develop their ideas with support from experts in R, open science and statistics. We ended up with five projects addressing questions from, ‘Who has the least access to nature?’ to ‘Where should citizen scientists go to collect new data?’.
At the end of this post I’ll give some advice for those considering organising a hackathon, but first, let’s hear how the teams go on…
Starting the day with only a page of pre-submitted research ideas and a lot of enthusiasm, five teams competed for the top prize. Here are their achievements in the words of members from each team.
Can We Extract Biological Records from Social Media? (on Github)
By Joseph Millard
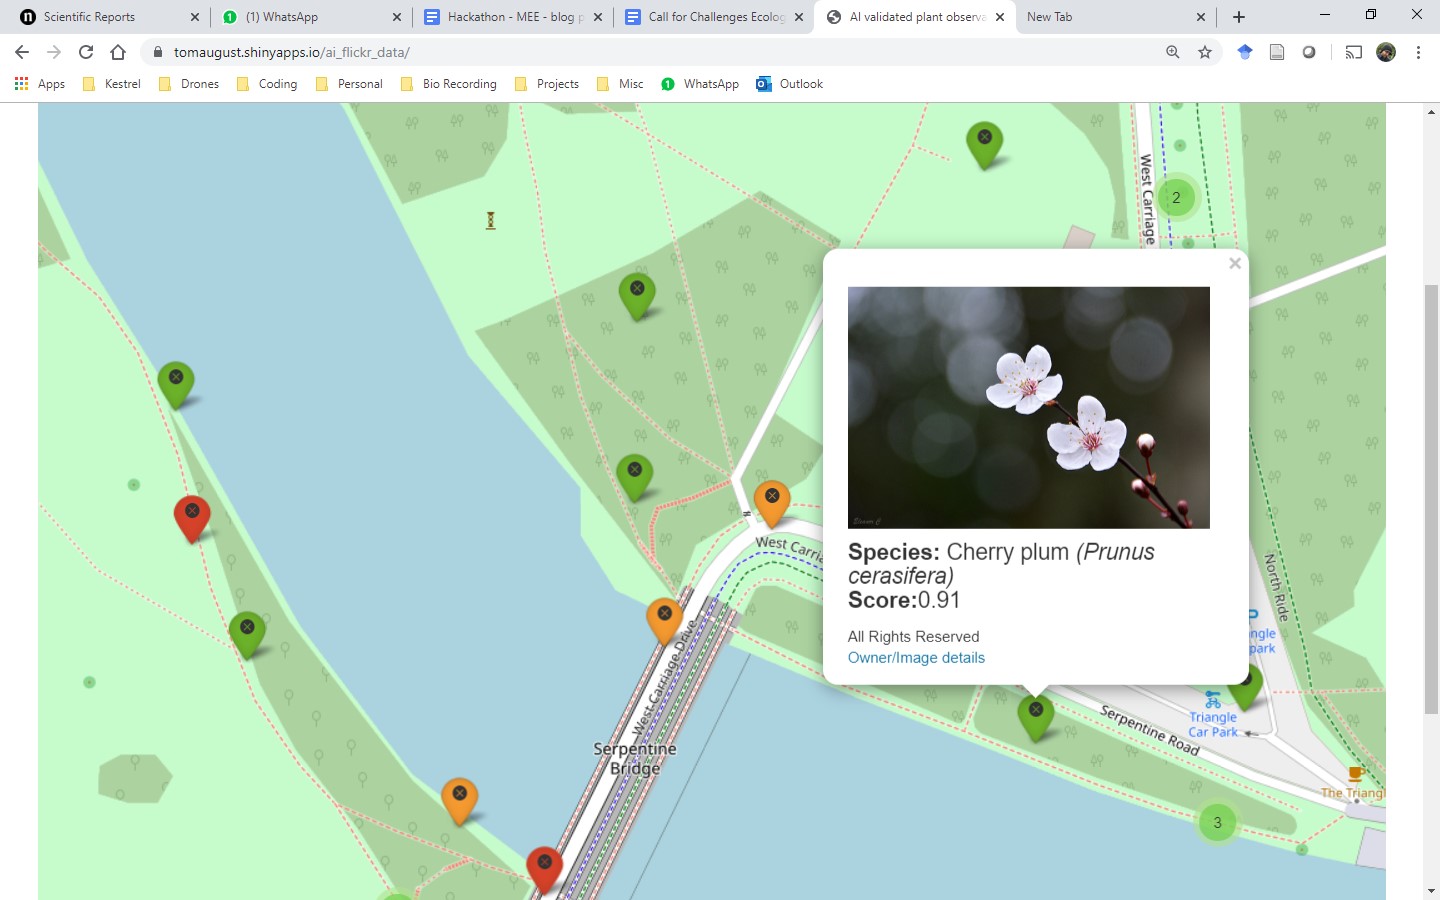
Our group combined two open-source R packages – ‘photosearcher’ and ‘plantnet’ – to build a real-time map of plant observations in London. ‘photosearcher’ retrieves photos from Flickr according to a series of search terms. plantnet interfaces with a plant image classifier, returning a species identification and an associated likelihood for a given photo. Using leaflet and RShiny, we then mapped the output of photosearcher and plantnet onto an interactive map of London. This allowed us to display the geographic location of each photo and its approximated species-level identification from PlantNet’s the image classifier. After the workshop Tom used the code we shared on GitHub to take the idea further, creating a large, AI verified, dataset of over 30,000 plant observations in London. That dataset is now available on Zenodo.
Who has the Least Access to Nature in the UK? (on Github)
By Owen Middleton
Having access to green space is fundamental for human wellbeing. It is currently unknown whether different age classes have the same access to nature across the UK. Using data on the average age range per ward across the country, we looked at the distance of wards from protected areas and national parks. We also linked this with national biodiversity records. Unfortunately, due to awkward data formats, we only managed to make some quick biodiversity maps for each ward. But, the hackathon enabled a group of us with a shared interest to quickly begin a project that will continue into the future (as yet another side-project!).
Standardising Citizen Science Datasets (on Github)
By Andrew Davis
The downside to using citizen science data is that they’re often not received in a standardized format. They might contain a variety of errors, creating a significant amount of work for researchers prior to analysis. This could even limit downstream analysis options in certain cases. Our group was given a citizen science dataset of fish in the Indo-Pacific. Instead of cleaning the dataset itself, we built an R Shiny app to standardize future data inputs. Taking this bigger-picture approach to solving the problem led to us creating a tool that will benefit all future efforts. The app can be modified to fit any specific data input needs, so it’s not limited to any specific format.
Aggregating Data on Trees (on Github)
By Paul Evans
As part of a plan to establish a UK-wide database of urban trees to support management, research and strategic planning around the UK urban tree resource, the hackathon group was tasked with two jobs:
- to build a standard that the urban tree community can work to, ensuring that future data are consistent and can be aggregated
- aggregate existing species data that had been recorded in different forms, and with differing tree names and varieties.
Using various word-matching functions, we had a higher rate of success than in previous attempts. Work is continuing to improve it further.
So You’re a Citizen Scientist in the UK: Where Should You go to Record? (on Github)
By Lea Dambly – Overall winners
Wouldn’t it be great to have a tool that highlights under-recorded areas to encourage citizen scientists to fill those knowledge-gaps? Our group used eBird data to create a Shiny app that displays which areas of Wales should be prioritised for sampling based on two different measures. Firstly, we looked at spatial coverage by counting the number of times a coordinate (rounded to one decimal place) had been sampled. Secondly, we quantified the sampling effort by calculating species accumulation curves for each coordinate. This approach could be modified for many different citizen science schemes with different priority measures.
So, is Organising a Hackathon for You?
Feedback from participants in the Quantitative Ecology hackathon showed that people enjoyed the chance to work in a new environment with people who have different areas of expertise in a new environment. It gave them the chance to learn new skills and try out methods and tools they wouldn’t otherwise have a chance to use. Also, it was a great opportunity to meet like-minded people. There was also a strong feeling that more active learning activities, like hackathons, should be run by the BES SIGs.
As a first time organiser of a hackathon, I was really happy with how the day went. I’d strongly encourage others to consider hackathons as a way to share skills, work up pilot projects or build your networks. This said, the laid-back, DIY vibe of the day hides a lot of behind-the-scenes preparation that were key to the day’s success. For those thinking of running their own hackathon, here are my four top-tips:
- Decide what your day is for. For us it was about skill sharing and networking. You might want to focus on R-package development or generating paper ideas from a dataset for example. Make sure you design your day around this objective, and have the support in place to make this happen.
- Prepare projects. Hackathons are short, so get as much done beforehand as possible. I had attendees suggest projects before the event in an open Google Doc. In the document, project proposers outlined their idea and linked to papers or data that the idea was built on. Participants signed up to projects they wanted to work on with their email address in the same document. As a consequence, most teams had already been in conversation over email before the day and could get down to the coding quickly. Well-defined projects with an enthusiastic champion tended to get more out of the day.
- Prepare data. Pretty much all projects will depend on data. To avoid long download times and frustrations loading data in strange formats, it’s best to get project leads to bring the data needed on a memory stick. Then it can be quickly shared around the team. It’s even better if the data has been converted into a format that your participants are going to be familiar working with.
- Keep it fun. I believe hackathons should be fun and intense, but not stressful. To get this off on the right foot I invited Anna Krystalli who gave a great motivational introduction to the day. We had lots of sweets, coffee, and food to keep energy levels high and at the end of the day there were a range of awards that made sure nobody went home empty handed.
This will certainly not be the last hackathon the Quantitative Ecology SIG runs. Subscribe to our mailing list and follow us on Twitter to keep up-to-date with all of our events.

Some people may think that it’s controversial to take part in a hackathon and spend your free time on coding. However, hackathons are fantastic for people with competitive nature, who like problem-solving and who like to bring ideas into life.