Post provided by Mariana García Criado, Isla Myers-Smith, Lander Baeten, Andrew Cunliffe, Gergana Daskalova, Elise Gallois and Jeffrey Kerby

Team Shrub (www.teamshrub.com), are ecologists working to understand how global change alters plant communities and ecosystem processes. In May 2020, Team Shrub held a lab meeting to discuss working with other people’s data. Inspired by the conversation, they decided to put a blog post together to explore the importance of careful data cleaning in open science, provide 10 best practice suggestions for working with other people’s data, and discuss ways forward towards more reproducible science.
‘How much data cleaning is enough?’
Ecology is collectively moving towards more open and reproducible science. This push has created avenues for cross-border collaborations, extensive data syntheses and wider data sharing. This beneficial process has facilitated research at the macroecological level, with many of us working with data collected by many other people around the world to identify common patterns across large geographical scales. However, large amounts of data (especially from different sources) also entail considerable amounts of work to understand the structures inherent in these collated datasets (e.g., sampling design, system boundary definitions, units, etc.), looking for anomalies and ensuring consistent data formatting – all vital processes to confirm our interpretations are robust. While agonising over yet another day scanning for duplicates in my database, I (Mariana) realised that I had not read before any specific guidelines on cleaning other people’s ecological data. So, Team Shrub organised a discussion to collectively share best practices on data cleaning and attempt to address the (possibly) centuries-old question ‘How much data cleaning is enough?’
The Importance of Reproducibility and Open Science
Even in the most transparent efforts at conducting science, issues in our data can arise at different stages of the scientific process:
Sampling bias: the selection of what data get collected, from where, and following which methodologies. When working on data syntheses, the selection of which data sources we choose to derive data can also introduce bias.
Processing bias: how and which samples get processed, including data cleaning.
Analysis bias: which samples get analysed, following which methods and why.
Interpretation bias: interpretation of the results in the paper, the effect of researchers’ preconceived notions in the interpretation of the data.
Publication bias: more dramatic results are more likely to be published both in the first place and in higher profile outlets, and potentially more reported in the media. Biases can be long-held, arise during interpretation once published (meta analyses), and through media/science communication.
In addition, lack of first-hand knowledge about a particular system (e.g., biome, ecosystem) can lead to incorrect decisions during data cleaning. Certain information cannot be derived from databases alone and lacking detailed knowledge about the characteristics of the study sites will certainly influence which samples get cleaned (processing bias) and analysed (analysis bias), and how data are interpreted (interpretation bias).
When working with other people’s data, you take on the responsibilities of making sure, as best you can, that the data are what you understand them to be and ultimately the full database becomes your responsibility (and the data curator’s). Malpractices in data collection and analyses can ultimately lead to challenging situations like paper retractions. The ramifications of accidental or intentional data manipulation not only move science backwards as a whole, but also shatter public perception and trust in scientists’ credibility.
Being open about all the steps in data cleaning and analyses shows you take this responsibility seriously. Here at Team Shrub, we pride ourselves on following open science guidelines as much as we can and strive to make our code and data publicly available to ensure reproducibility and transparency. We are firm advocates of GitHub for version control and collaborative coding. By making efforts to be open and reproducible, we as a community ensure that any potential errors/biases in the data would be genuine mistakes (we are human after all!) and can be ultimately corrected.

Data Cleaning with a Clean Conscience
When working with multi-site data that has been collected by other people, many of our efforts should go into mitigating the ‘processing bias’ by cleaning these ‘dirty data’. Generally, cleaning practices can differ depending on two main scenarios: a) inheriting data that someone else collected (e.g., your lab group, a collaborator), so you probably know the collectors and can easily ask for clarification and further details if needed; and b) using data from open databases (e.g., TRY, Living Planet Database), so most of the time you don’t know the data collectors and contacting them with queries requires time investment and does not guarantee a response. A big part of the question ‘how much is enough’ largely depends on personal attitudes towards risk (and how much of an over-thinker you are). But more time invested on data cleaning won’t necessarily get you to shinier datasets, nor to feeling 100% comfortable with your decisions, if you don’t know what exactly to look out for. To provide a data cleaning roadmap, here are the practices we have collectively compiled to perform thorough checks during data cleaning.
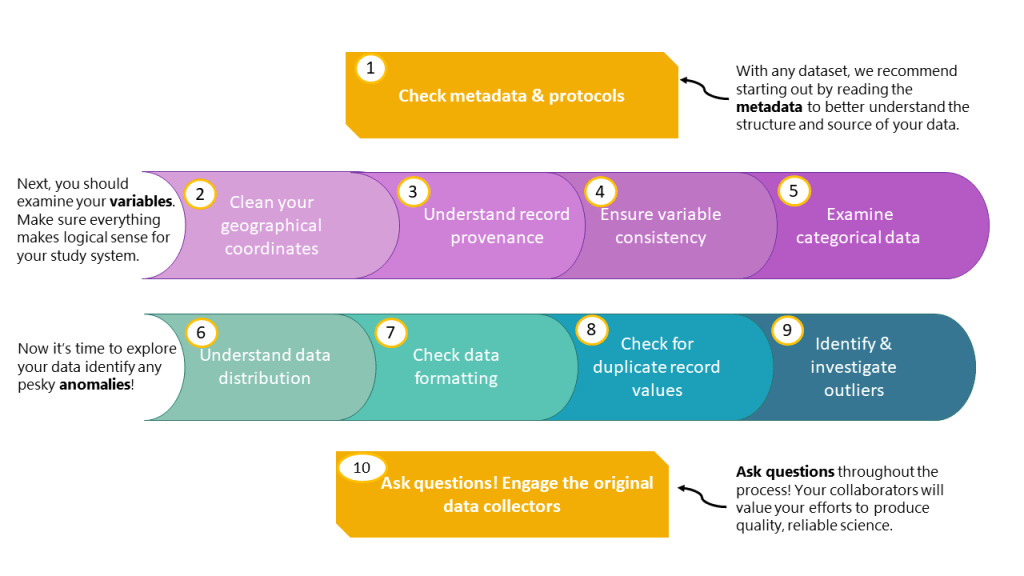
10 Best Practice Ideas on Data Cleaning
Understanding your data
- Check metadata. If available, metadata will provide an invaluable source of understanding of the structure of your datasets and will inform the decisions that you make when filtering and cleaning data. If protocols are available outlining how the data were collected, they might yield important insights into what the data mean, so look out for articles’ methods sections or stand-alone protocols on data collection and/or curation.
Dive into your variables
- Clean your coordinates. Verify that all your records share a consistent coordinate system, scout for potential flipped coordinates (latitude values that are in the longitude column and vice versa), and wrong coordinates that don’t match the site/country. The R package CoordinateCleaner includes tests to identify spatial and temporal outliers, among others. Plotting your geographical data on a map will also help identifying those supposedly terrestrial plants that are found in the middle of the ocean, for example.
- Understand record provenance. In certain datasets, you will find massive richness hotspots around St Louis (US) or London (UK). This is not because Missouri and England have recently become biodiversity paradises, but because many records have been tagged with the geolocation of the Missouri and Kew Botanical Gardens, where the herbarium specimens are stored but not where they were originally collected from. Make sure to check out the provenance of your records, especially when it comes to botanical gardens, zoos and museums.
- Ensure variable consistency. This includes confirming that all units and variable names are the same across data sources. Make sure as well that all the values in a column are the same type (e.g., factor, integer, etc.). Confirm that all values have a decimal point instead of a comma. Explore how precision varies across the different data sources you are compiling and be careful when rounding up. For example, some data might be recorded with three decimals, and other with just one, creating an imbalance in precision. More broadly, ensure consistency in variable meaning across datasets: for example, ‘green up date’ can mean different things to different research groups and some analyses will be very sensitive to small differences in variable meanings, whereas others are much more logically robust to these issues. Knowing if your analysis is philosophically robust (and then accounting for that statistically or finding more appropriate questions) is a critical early step.
- Categorical data. When working with categorical data, check out the unique values per column. There might be typos in how a particular category was spelled, so take care of standardising them to ensure appropriate distribution of categories. A particular case related to categorical data is checking your species names. Different datasets will follow different taxonomic references, especially if composed by multiple contributors. Standardising species names can be a key process to have the largest possible sample size. Using R packages like ‘taxize’ or ‘TaxonStand’ for cleaning spelling and latest approved names of species names in an automated way will save you time and headaches trying to understand the latest lumper vs. splitter battles.
Check anomalies through data exploration
- Understand the distribution of your data. Check that all values make sense by making use of first principles: for example, if you know that a variable should only have positive values (e.g., specific leaf area), check that there are no negative values. This can be quickly done with exploratory visualizations like scatterplots or density plots.
- Data formatting. Check for all possible versions of an “NA” value or empty cell, as there are behaviour differences between NAs, N/A and NaN. For example, you can have a genuinely blank cell which in R would appear as a greyed out NA, you can have a full cell where the data collector has typed “NA” or “N/A”, thus the cell is a character or factor, and even trickier, sometimes there is just a single space in a cell, making it look blank, when in fact it’s not! Removing all NAs (all versions of them) in an entire data frame at once can be a bit dangerous as you might lose actually usable data. For example, if there is a column “Notes”, there might not be a note for each row, and if you remove NAs across the whole dataset and not just in the columns of interest, you might unnecessarily reduce your sample size. Consider setting up code to fill and standardise all blanks so you don’t lose any information.
- Duplicate record values. My (Mariana’s) dreaded personal foe is duplicate records! Tackling what might be different records with the same values (‘false duplicates’), versus the same record inputted twice due to merging of datasets (‘true duplicates’) is a particularly tricky issue when working with large databases with data from different sources. The best approach I’ve found to this is to group values by coordinate, contributor, species, variable and value, and to check those whose values are the same. Here is when your judgment comes in. If the value in question seems pretty feasible, say, plant height of 0.5 m, it is likely that a few individuals in the same plot would have the same height, particularly if the data collectors were rounding up to the closest decimal. On the contrary, it would be unlikely for two different individuals to share a specific plant height value of 1.5482 m – these are red flags that would merit further investigation. If the dataset contains unique identifiers, these are extremely useful to identify and remove duplicates. If you are still doubtful, the last resort would be to track down the original collector datasets to double-check if the values were there in the first place.
- Outlier values. These might be true values or erroneous, which could happen because of a mistake when inputting the data (e.g., 80 instead of 8 cm) or because they were inputted in the wrong units (e.g., a reported plant height of 55 m which were supposed to be 55 cm). Useful strategies to identify outliers include i) exploratory visualisations, ii) identifying the minimum and maximum values of a given variable, iii) checks of how individual measurements relate to the standard deviation of a variable, iv) investigate distribution at multiple levels (plot, year, site, etc.), and v) implement code quality control checks to verify that variable values are within plausible ranges. Just remember that you need to have a very good reason to remove an outlier, as they can very well be ‘true’ values, so always investigate before deleting.
Get confirmation
- Ask questions! It is always good practice to ask for clarification from the original data collectors. If you think there might be a mistake in the data collection, do ask the data collectors politely. You can put together site reports to share with the collectors, showing mean values, distributions and site level versions of the analyses for a clear outline of the potential issue. Encourage interactional collaborations by engaging your data contributors at key stages early on. This can be a really great way to pick up issues and to engage your future co-authorship!
Many questions will arise during the data cleaning process – for example, should you include records with incomplete geographic coordinates? What happens if your data don’t fit standardised categories, should you make a different category or assign those data points to an NA category? These are decisions that you will be making based on your understanding of the data and further analysis, provided that you document your decisions in your code and manuscripts. Always keep a version of your raw data and the script you used for cleaning, thoroughly documenting your decisions by commenting your code to ensure reproducibility. On Team Shrub, we have learned that the hard way in our early synthesis work! Also, write appropriate metadata describing your data and data cleaning, which will also be extremely helpful for potential future users.
Clean Data Leads to Rigorous Science
Given how much data cleaning can alter the robustness of analyses and their subsequent impact, we would expect this to be a very relevant step in any scientific process, if we want to be truly confident in our science. After all, “how well you clean and understand the data has a high impact on the quality of the results”, as Omar Elgabry says. But there is hardly any recognition for good data cleaning in academia, and published articles tend to describe this process very broadly without offering sufficient details for reproducibility. Assessing the quality of data cleaning undertaken by scientists should be at the core of peer-review of data syntheses, and more journals could facilitate this part of the process by emphasising data processing checks and descriptions as part of manuscript submissions. We propose that data cleaning could be a more explicit section in scientific articles, and all the data checks and cleaning should be adequately documented, describing in detail the deleted and corrected records, and the effect of remaining outliers on analyses. Supplementary sensitivity analyses should also be provided, showing the influence of a particular choice in data filtering explicitly in the models (e.g., geographical scope, minimum plot size, study-level sample size, minimum population size). If models with and without that particular filter differ, the criteria for that choice would need further discussion and/or justification.
All of these processes take a lot of time, energy and sensitivity. Working with other people’s data is a huge responsibility that entails trust among collaborators and should be undertaken thoughtfully. Collecting data is a major investment as well and as the person synthesising the data, you are working with people’s hard-won data that they may have invested days, months, years or an entire career into collecting. Equally, leading data syntheses and following open science best practice take a lot of time too. For us this process takes years to complete: the careful checking of data, the coordination with data contributors, the soliciting and incorporation of feedback from co-authors (sometimes over a hundred co-authors in big collaborative efforts), finally resulting in new findings and a publication that will benefit everyone. Working with other people’s data can lead to a win-win collaboration, but only when we all put the effort in.

We acknowledge how the pressures of the scientific process – publish or perish, lack of funding, competitive job market – can make scientists shift their focus to these more pressing issues. But thorough science is at the core of good science, which ultimately defines our understanding of species, ecosystems, and ecological theories, guides conservation and management efforts and informs policymaking.
If we can move forward as a community to be both more rigorous and open with our data, we will be simultaneously advancing science as a whole – in a robust, consistent, and forward-thinking manner. While admittedly open science practices are not equally accessible for all, and we are far from fully open science in ecology, we can all do our share (whatever that might be – every little bit counts) to care for a more open and inclusive science for everyone.
