Post provided by Bruno Vilela
Just over a decade ago, I was beginning my PhD in Ecology and Evolution at the Federal University of Goiás (UFG), Brazil. I was especially excited about the program’s emphasis on quantitative approaches. During my undergraduate and master’s studies at a natural history museum, I had been struck by how much information biological collections held and how little of it we used. I hoped my PhD would give me the tools to tackle that.
One of my first assignments given by my advisor, Professor Levi Carina Terribile, was to map the global diversity of mammals. This meant overlaying thousands of IUCN species distribution shapefiles onto a geographical grid. Existing GIS software could automate parts of the process, but handling so many species still required splitting the data into subsets, repeating operations, and combining the results. I could already picture the endless clicking. Surely the computer could do that for me, even if learning to program took longer.
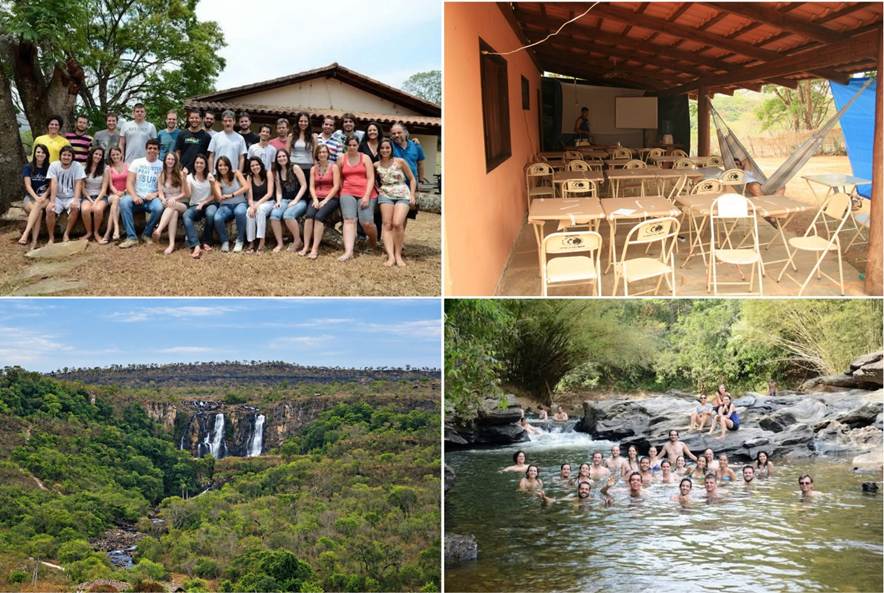
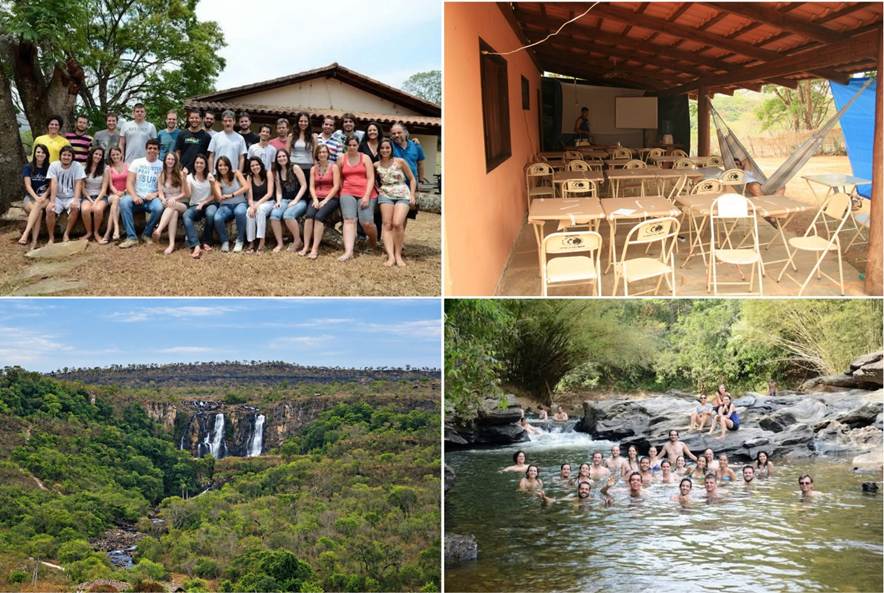
As it happened, Professor Adriano Sanches Melo was about to teach an R programming course in Pirenópolis, Goiás (the location was near a river and waterfalls). Not a bad place to learn R! Our final assignment was to create a function, so I wrote one to turn distribution shapefiles into a species presence-absence matrix, a familiar starting point in community ecology and macroecology.
What I did not expect was how quickly that script would travel. Colleagues began using it and returning with questions, suggestions, and bug reports. Soon, researchers from other universities, and eventually other countries, got in touch. With different versions circulating, I struggled to keep track. My friend Sara Varela, visiting our lab at the time, suggested turning the script into an R package. Package development was less accessible then, and her guidance was fundamental to make it happen.
The package grew with new research questions and user requests. My friend and roommate Fabricio Villalobos, then a postdoctoral researcher in our lab, was developing complementary functions, so combining our efforts into one package felt natural. We named it letsR, after the “Laboratório de Ecologia Teórica e Síntese” (LETS), coordinated by Professor José Alexandre Diniz-Filho, where the project began.
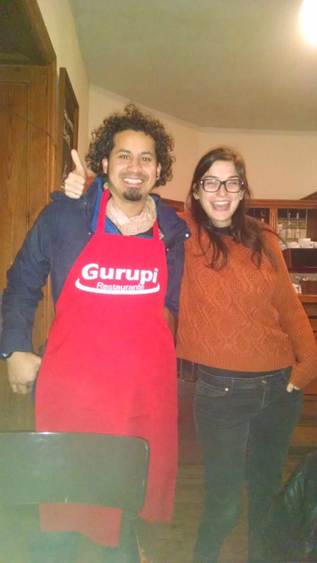
When the package was sufficiently developed and tested, we submitted a manuscript to Methods in Ecology and Evolution in 2014. One detail worth mentioning is that Fabricio and I made the final revisions and submitted the manuscript from a bar in Alcalá de Henares, Spain. Perhaps not the most conventional setting for a scientific submission by two Latin Americans, but certainly memorable. After a few rounds of constructive reviews, during which I learned plenty more about R packages, the paper was published in 2015!
Beyond geography
For years, letsR was largely about making it easier to answer a familiar question: why does species richness vary spatially? But that question eventually led us to another: what exactly do we mean by space?
Our geographical instinct is hardly surprising. Long before ecology became a science, knowing where species occurred was essential to survival. The Kayapó people of the Brazilian Amazon, for example, have detailed knowledge of where Brazil nut trees grow and when their nuts can be harvested. In ancient Greece, Theophrastus described how plants respond to soil, water, and climate in Historia Plantarum. Across very different cultures and times, the relationship between species and their environments has been a central concern. More than two thousand years later, we still ask why species occur in some places but not others.
Perhaps we approach these questions geographically because physical space is what we experience most directly. We navigate it, perceive distances, and recognize boundaries. This reminds me of Kant’s argument that knowledge is shaped both by sensory information and by the structures through which we organize experience, including space. But we can also conceptualize space differently. In mathematics, for instance, space can be defined in other ways by using different sets of dimensions to describe positions, distances, and relationships among objects. Geography is one such space, but certainly not the only one.
When exploring biodiversity patterns, for instance, two locations thousands of kilometres apart may have nearly identical climates, placing them far apart geographically but close in environmental space. Conversely, neighbouring locations may occupy very different positions in environmental space. The same applies to species: two mammals on opposite sides of the planet may be close in attribute space because they share similar body sizes, diets, or genes. Of course, ecologists have long studied environmental and functional spaces. What interested us was how to connect them systematically with geography. What happens if we treat geographical, environmental, and attribute spaces as complementary representations of biodiversity? Can we measure the geometry of diversity in one space and investigate how it relates to patterns in another?
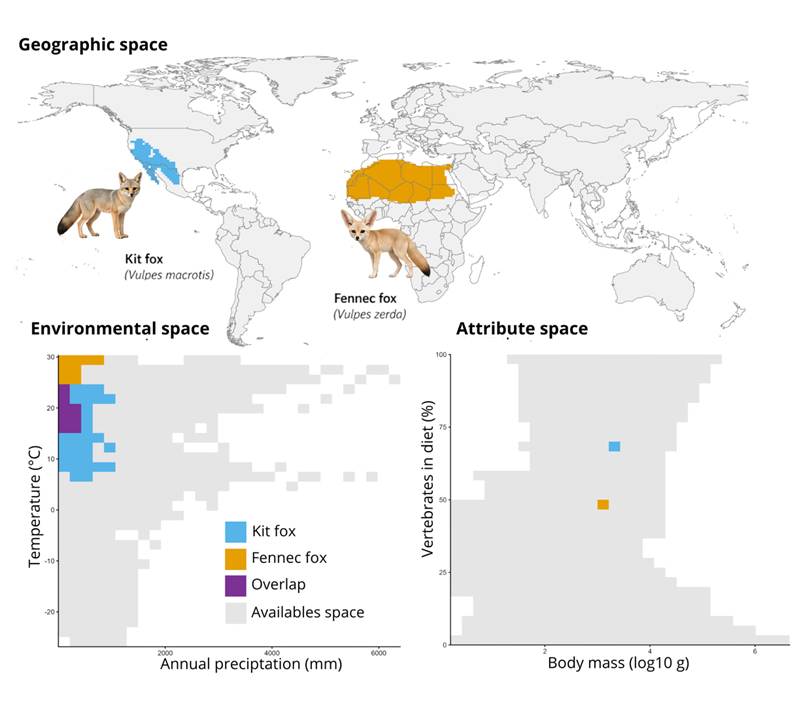
These questions motivated our recent paper in Methods in Ecology and Evolution, “Mapping diversity through geographical, environmental and attribute spaces.” The framework uses linked presence-absence matrices to measure geometric properties of biodiversity in one space and examine their relationships with patterns in the others. The challenge was to make such analyses accessible and reproducible without requiring a new computational workflow for every question.
And this is where letsR comes back into the story.
More than a decade after its first version, we have expanded letsR to construct, visualize, and connect biodiversity patterns across geographical, environmental, and attribute spaces. The project has also become much more collaborative. While the original paper had just two authors, the new study brings together eleven researchers associated with the Brazilian National Institute of Science and Technology in Ecology, Evolution and Biodiversity Conservation (INCT EECBio). Their different perspectives helped turn practical functions into a broader methodological framework.
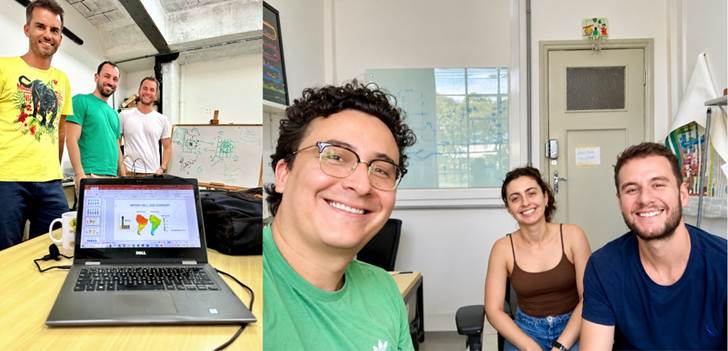
Looking back while writing this post, I realize this is how letsR has always grown: through Adriano’s R course, Sara’s advice, Fabricio’s ideas, and years of feedback from researchers exploring questions we had never imagined. And, fittingly, we returned to global terrestrial mammals to illustrate the new framework. More than a decade after that first programming assignment, we have moved from mapping biodiversity in geographical space to exploring its connections across spaces. And, once again, the story has found its way into Methods in Ecology and Evolution.
About the author
Bruno Vilela is a biologist and Professor of Ecology at the Federal University of Bahia (UFBA), Brazil. His research focuses on understanding large-scale patterns of biodiversity and evolution, particularly how geographical, environmental, and evolutionary processes shape biological and cultural diversity. He is also interested in developing open-source computational tools that make ecological research more accessible and reproducible. Learn more about his research on his personal website or visit the letsR website.
Read the full article here.

