New clues are helping University of Delaware researchers develop an online map to help Mid-Atlantic fishermen avoid catching Atlantic sturgeon.
Researchers at the University of Delaware are one step closer to developing an online map that would help Mid-Atlantic fishermen avoid catching Atlantic sturgeon.
The research team, led by Matthew J. Oliver, Patricia and Charles Robertson Professor of Marine Science and Policy, found they could make useful predictions about sturgeon locations using satellite measurements of ocean color and temperature. They reported their findings Feb. 3 in the journal Methods in Ecology and Evolution.
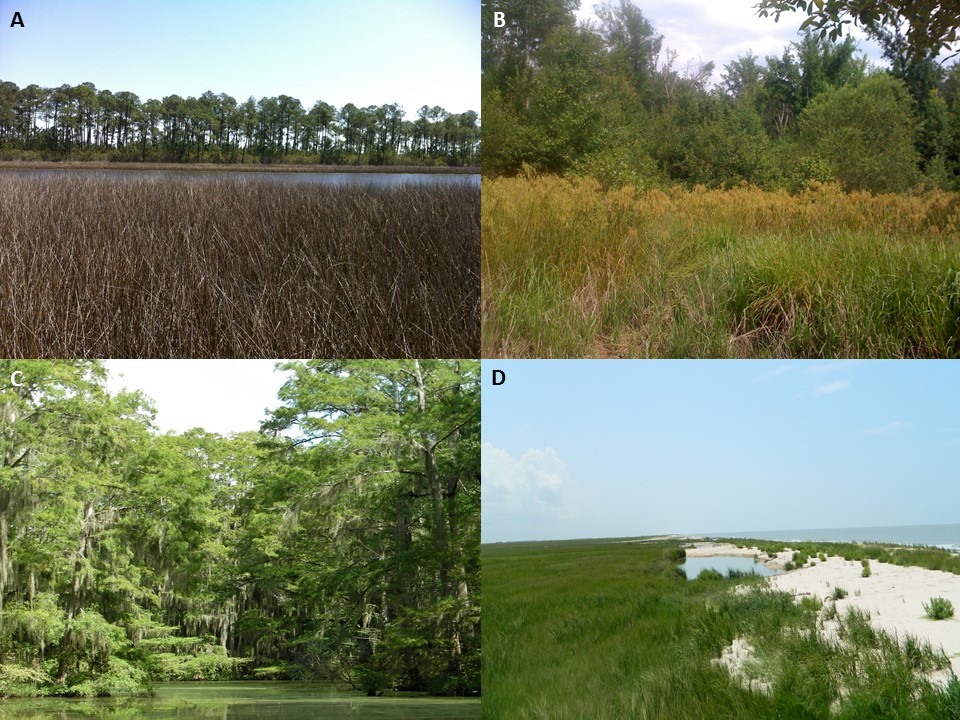
Today is World Wetlands Day, a day to raise awareness about wetlands and the many ecosystem services that they provide. Wetlands are broadly defined as areas saturated or inundated with water for periods long enough to generate anaerobic soils and support water-loving plants. They include bogs, swamps, floodplain forests, marshes and mangroves.
Some may wonder why these habitats deserve their own day of recognition, as wetlands can evoke images of the soggy, unpleasant wild places– the “ghast pools” of Dante’s Divine Comedy or the “waste places” of Beowulf. Unfortunately, these descriptions overshadow the true beauty and value of the world’s diverse wetland ecosystems. For those of us dedicated to researching and enjoying wetlands, these areas are worth appreciating every day of the year for numerous reasons.
In honor of World Wetlands Day, I will make the case for wetlands and highlight an example of a new research tool designed to understand how coastal wetlands may respond to sea-level rise.
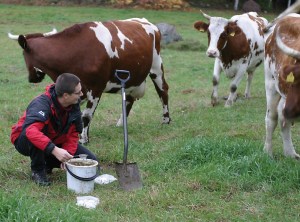
Studies of ecosystem function are studies of action: of insects pollinating flowers, of predators killing pests – and in our case (well, more often than not) of beetles disposing of dung. To isolate the effects of the critters that we think will matter, we need to selectively include or exclude them. If we think a particular species or species group is responsible for a certain function, then we test this by keeping it in or out of enclosures. If we want to look at effects of species diversity, then we create communities of different species richness.
Depending on the target organism, this is sometimes easy and sometimes difficult. But it almost invariably proves to be fun! We enjoy the challenge of inventing new techniques for unravelling ecosystem functions sustained by insects. Working on dung beetles – as we tend to do – can be messy, but it’s definitely never boring.
In targeting ecosystem functions, the real trick is to make the experiments relevant. What we want to understand are the effects of changes occurring in the real world. All too often studies of ecosystem functions have been focused on artificial species pools in artificial settings. To see how we have solved this, we’ll give you a quick look at our dungy portfolio of approaches to date. Continue reading “Disentangling Ecosystem Functions: Our Imagination is the Limit”
Isotopes are atoms that have the same number of protons and electrons but differ in their number of neutrons; they are lighter and heavier forms of the same element. Unlike radioactive isotopes, stable isotopes do not decay over time.
Post provided by ALISTAIR HOBDAY (senior principal research scientist, CSIRO Australia), Tim Lynch (senior research scientist, CSIRO, Australia) and Rachael Alderman (wildlife biologist, Tasmanian Department of Primary Industry, Parks, Water and Environment, Australia).
Behavioural and ecological research and monitoring of wildlife populations are based on collection of field data. Demographic data, such as breeding frequency, birth rates and juvenile survival, have been critical in understanding population trends for a wide range of species.
Photography has been extensively used by field biologists and ecologists to gather these data and they have been quick to take up improvements in this technology. Many field programmes today use photography either for primary data collection or the communication of results. Advances in digital photography, image storage and transmission, image processing software and web-based dissemination of images have been extremely rapid in recent years, offering ecologists and biologists a range of powerful tools.
Digital imagery has been captured from a wide range of platforms, each of which has various advantages and limitations for biological study. The most remote images are captured from satellite-based sensors, which have been used to assess population abundance of large animals, such as elephant seals, or locate colonies of emperor penguins. Cameras mounted on aircraft can also provide large-scale perspectives but both of these platforms suffer from high cost, operational limitations due to weather, and limited temporal replication. Recent use of drones, while cheaper, still requires a person to be close to the survey location and can only be used in short bursts, typically lasting less than 20 minutes.
Land-based cameras – or those fixed onto animals – can track behaviour closely, but have low sample size as data tends to be collected at the scale of individual or small groups. To improve replication, fleets of remote cameras can be used or multiple images stitched together post hoc to form a montage. However, this increases cost, either for hardware or labour to manually construct panoramas. To date all these camera systems have had limits to their spatial and/or temporal resolution and, therefore, to the number of individuals covered. This restricts biological study at the population level. Continue reading “High-Res Camera Surveys of Wildlife Colonies: The advantages over traditional approaches”
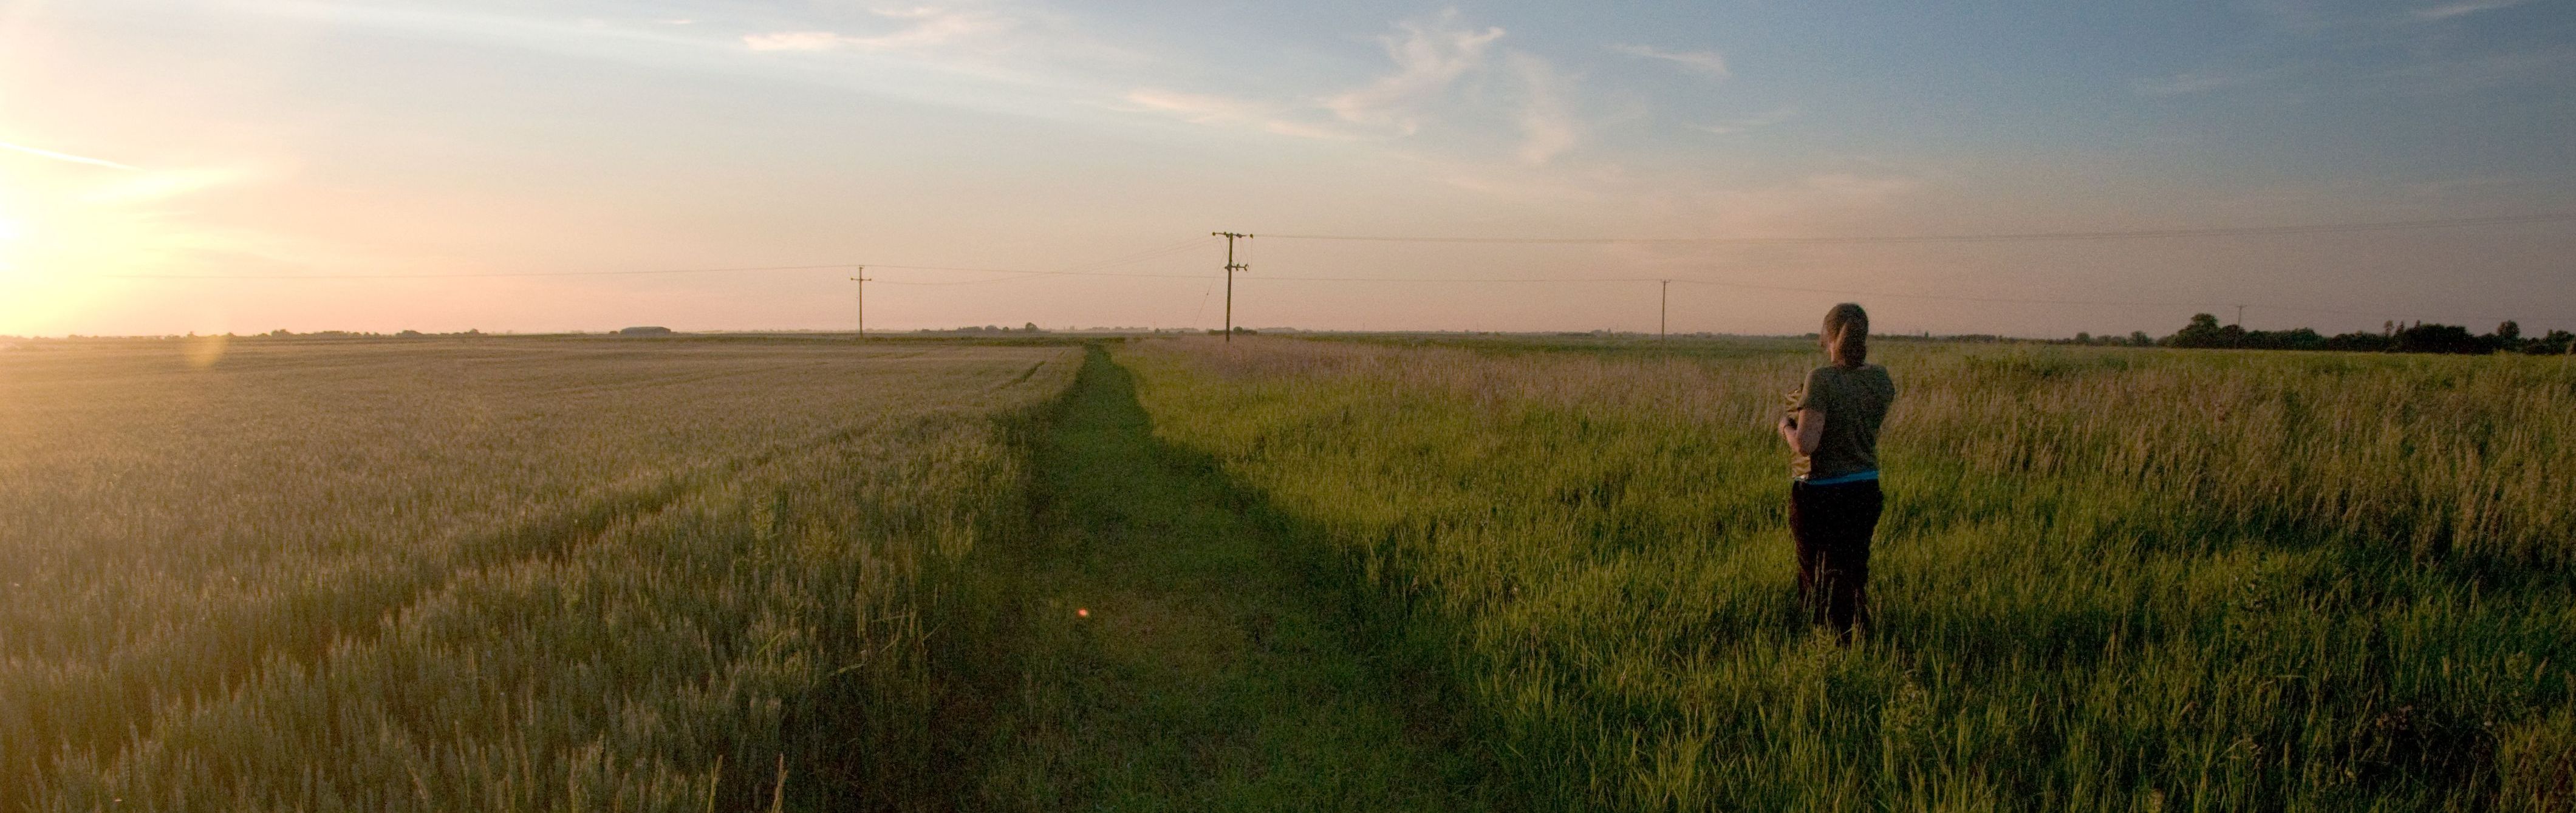
It’s 6am on a warm spring morning and I’m about to visit the second of my Breeding Bird Survey1 sites. Like 2,500 other volunteers in the UK, twice a year I get up early to record all the birds I see or hear on the two transects in my randomly selected 1km square. Each year I look forward to these mornings almost as much for the comparisons as the actual sightings. Will there be more or fewer sightings of our summer migrants this year? How will numbers in this rolling Norfolk farmland stack up against those I see in urban, central Norwich?
But simply recording these changes is not enough; we need to understand why they occur if action is to be taken. This requires us to quantify the demographic rates (survival, productivity and movements) that underlie them, which in turn requires samples of marked individuals. Simply counting individuals is not enough. Continue reading “Making the Most of Volunteer Data: Counting the birds and more…”
Post provided by Christophe Laplanche, Tiago Marques and Len Thomas
1km Deep
Most marine mammal species spend the majority of their lifetime at sea… underwater. Some species (like sperm whales, beaked whales, and elephant seals) can go routinely as deep as 1000m below sea level. To mammals like us, these incredible depths seem uninhabitable. It’s cold, dark, under high pressure (100kg/cm²) and 1km fromair! Yet deep-diving marine mammals thrive there and have colonized every deep ocean on the planet. They have developed amazing capabilities for that purpose – including efficient swimming, an advanced auditory system, sonar (in some cases), thermal insulation, extreme breath holding abilities and resistance to high pressure.
How is that possible?
Spending most of their time at depth makes them quite difficult to study. And we have a lot of questions to ask them. How do they balance swimming cost versus food intake? Do they forage cooperatively, in groups? For those with sonar, how does it work? With increasing human activities (oil exploration, military sonar, sea transport, fishing etc.) an important new question arises: how do they cope with us?
Finding a call of a particular primate species within hours and hours of audio recordings of a forest is no easy task; like finding a ‘needle in a haystack’ so to speak. Automated acoustic monitoring relies on the ability of researchers to easily locate and isolate acoustic signals produced by species of interest from all other sources of noise in the forest, i.e. the background noise. This can be much harder than it sounds. Think about whenever you have to use any kind of voice recognition system: seeking out a quiet room will greatly improve the chances you are understood by the robot-like voice on the other end of the phone. If you ever set foot in a rainforest the first thing you’ll notice is that it is anything but quiet. In fact characterizing and quantifying soundscapes has become a marker for the complexity of the biodiversity present in a given environment.
Primate monitoring programmes can learn a great deal from cetacean research where Passive Acoustic Monitoring (PAM) is the norm (since individuals are rarely observable visually). Research on bats and birds can provide excellent examples to follow as well. Automated algorithm approaches including machine learning techniques, spectral cross-correlation, Gaussian mixture models, and random forests have been used in these fields to be able to detect and classify audio recordings using a trained automated system. Such automated approaches are often investigated for a single species but impressive across-taxa efforts have also been initiated within a framework of real-time acoustic monitoring. Implementing these in other research fields could lead to significant advances. Continue reading “Progress and Future Directions for Passive Acoustic Monitoring: Listening Out for New Conservation Opportunities”
Applied ecology can be defined as scientific knowledge that helps in making good management decisions. Scientists have a natural desire to collect information, managers want that information so that they know they are doing the right thing, and both generally act under the assumption that more information equals better decisions. This is generally correct, since information helps us make, well, informed decisions. Therefore, when our ecological knowledge is uncertain (which is practically always the case) we usually advocate further research.
On the other hand, however, information comes at a cost. It may cost money to collect it and take time to set up studies: both are usually in short supply. We can’t learn everything and often the information we can actually collect is still imperfect. So how do we determine if that additional piece of information we’d like to have is really valuable for our management?
In decision analysis, the value of information is the improvement in the outcomes of our actions that we would expect if we could reduce or eliminate uncertainty before making a decision. Previously applied in engineering, economics and healthcare planning, VOI is also intuitively appealing for environmental management, where decisions must be made in the face of ubiquitous uncertainty. Knowing the value of information can assist in designing monitoring and experimental programs, implementing adaptive management and prioritising sources of uncertainty. In other words, it can help applied ecologists and conservation managers find a focused, transparent way to address the inevitable need for “more data”.
An increasing number of studies are applying VOI to conservation management; however, in spite of its potential the technique is still underused in real-world applications, particularly beyond the small community of applied ecologists trained in decision-analytic methods.
Click Image to begin a Prezi Presentation on Value of Information
In summary, three things determine the value of information:
How much we already know (the more we know, the less beneficial it is to collect more information)
Whether and how we would react to that extra information by changing actions, and how much better would the updated action be
How good is the information we can actually get (think about sample sizes, imperfect detection, time lags, etc)
Lidar point cloud from a scanned Eucalyptus tree (left) with colours correlating to point density (blue to red moving from high to low density). On the right is the reconstructed tree volume from which mass can be estimated.
A terrestrial laser scanning technique that allows the structure of vegetation to be 3D-mapped to the millimetre is more accurate in determining the biomass of trees and carbon stocks in forests than current methods, according to new research involving UCL.
The research paper, an international collaboration led by Wageningen University, is published today in Methods in Ecology and Evolution and demonstrates the technique in Australian forests.
The study authors believe it could be an important development in the monitoring of carbon stocks for worldwide climate policy-making. Both above-ground biomass and carbon stocks are important details for UN-REDD, the United Nations initiative on Reducing Emissions from Deforestation and forest Degradation that is striving to keep the destruction of forests in check and thereby preserve the uptake of carbon by trees.
Paper co-author Dr Mat Disney (UCL Geography) said: “This new paper shows how effectively we can now turn highly-accurate laser measurements, comprising millions of 3D laser points, into estimates of tree mass. Weighing trees is really hard – time Continue reading “Laser scanning accurately ‘weighs’ trees”