Post provided by Pascal Title and Dan Rabosky

Within the tree of life there are differences in speciation and extinction rates over time and across lineages. Biologists have long been interested in how speciation rates change as a function of ecological opportunity or whether key innovations lead to increases in the rate of speciation. Exploring this rate variation and examining how clades differ in terms of their diversification dynamics can help us to understand why species diversity varies so dramatically in time and space. Learning more about the relationship between traits and diversification rates is especially important because it has the potential to reveal the causes of pervasive variation in species richness among clades and across geographic regions.
Several different classes of methods are available for studying the effects of species traits on lineage diversification rates. These include state-dependent diversification models (e.g., BiSSE, QuaSSE, HiSSE) and several non-model-based approaches. In our article – ‘Tip rates, phylogenies and diversification: What are we estimating, and how good are the estimates?’ – we assessed the accuracy of a number of model-free metrics (the DR statistic, node density metric, inverse of terminal branch lengths) and model-based approaches (Bayesian Analysis of Macroevolutionary Mixtures, BAMM) to determine how they perform under a variety of different types of rate heterogeneity. The “tip rates” using these approaches have become widely used for a few reasons, including ease of computation and how easy it is to pair them with other types of data.
The Benefits of Tip Rates

Tip rates are conceptually straightforward: they represent the predicted per-lineage waiting time at the present before a lineage will undergo another evolutionary event (e.g., speciation), conditional on recent evolutionary history.
Practically, tip rates let you summarise rates of diversification across non-monophyletic groups. This works well for summarising geographic patterns of speciation rate variation. Some recent examples of this approach can be seen in birds, mammals, and fishes. You can also associate tip rates with other species-specific traits, such as morphological data, without needing to resort to summarising by clade. Because of this, tip rates can be used to test hypotheses about how traits impact speciation rates. For some methods, such as the DR statistic, they can also be computed very quickly and at minimal computational cost, which means you can apply them to phylogenies that could include tens of thousands of tips.
Interpretation of Tip Rates
One goal of our study was to help researchers interpret the actual tip rates themselves. There has been significant confusion in the literature on this point. Specific metrics have been interpreted as (either) measures of “net diversification rate” or “speciation rate” by different researchers. This issue of interpretation is conceptually important for how we relate patterns of rate variation to potential controls on species richness through time.
Our first objective was simply to test – using simulations – whether different tip rate metrics are more accurate for estimating speciation or net diversification (net diversification = speciation minus extinction). All of the model-free tip rate metrics that we examined are more accurate estimators of the rate of speciation than the net diversification rate. These metrics, and in particular the DR statistic, have been incorrectly interpreted as a measure of net diversification rate in a number of papers. There’s a good chance that this is because of the somewhat misleading name of the DR statistic, which is often understood as a measure of the Diversification Rate. As we demonstrate (and as shown in the original description in Jetz et al. 2012), DR is actually a much better measure of tip speciation rate and is poorly correlated with the net rate of diversification (Figure 1).
The problem in misinterpreting these metrics is perhaps clearest when we consider the special case where a phylogeny grows under a balanced speciation-extinction process. In this scenario, speciation is exactly equal to extinction and the net diversification rate is zero. The resulting estimates of DR will be highly correlated with speciation rate, and will have no relationship to the true (zero) net diversification rate. These types of differences could heavily impact conclusions drawn in studies on equilibrial vs non-equilibrial diversity dynamics.
Accuracy of Tip Rates
Using a variety of simulated phylogenies from previously-published studies (including trees with discrete rate shifts, trees exhibiting diversity-dependence and trees where the rate of speciation itself varies continuously) we explored the accuracy of a number of tip rate metrics. Importantly, we tried to use phylogenies that were publicly available and that included the parameters of the generating process. Also, we included trees produced for several studies that were critical of BAMM’s performance (see our figure S5 for a summary by study).
Our overall conclusion is that the DR statistic does best among the model-free metrics, but generally not as well as the model-based approach, BAMM. DR is better at picking up rate shifts in small clades though. And when dealing with very large phylogenies it provides better computational speed. But BAMM was the more accurate approach across all of our tests.
Why is BAMM more Accurate than DR?
The main reason for this is that BAMM will only identify rate shifts when it has sufficient statistical power to do so. This means that it will tend to be conservative in the amount of rate heterogeneity that it identifies in a phylogeny. On the other hand, DR will always identify heterogeneity in tip rates as a function of stochastic variation in branch lengths, even when true rates don’t vary among lineages.
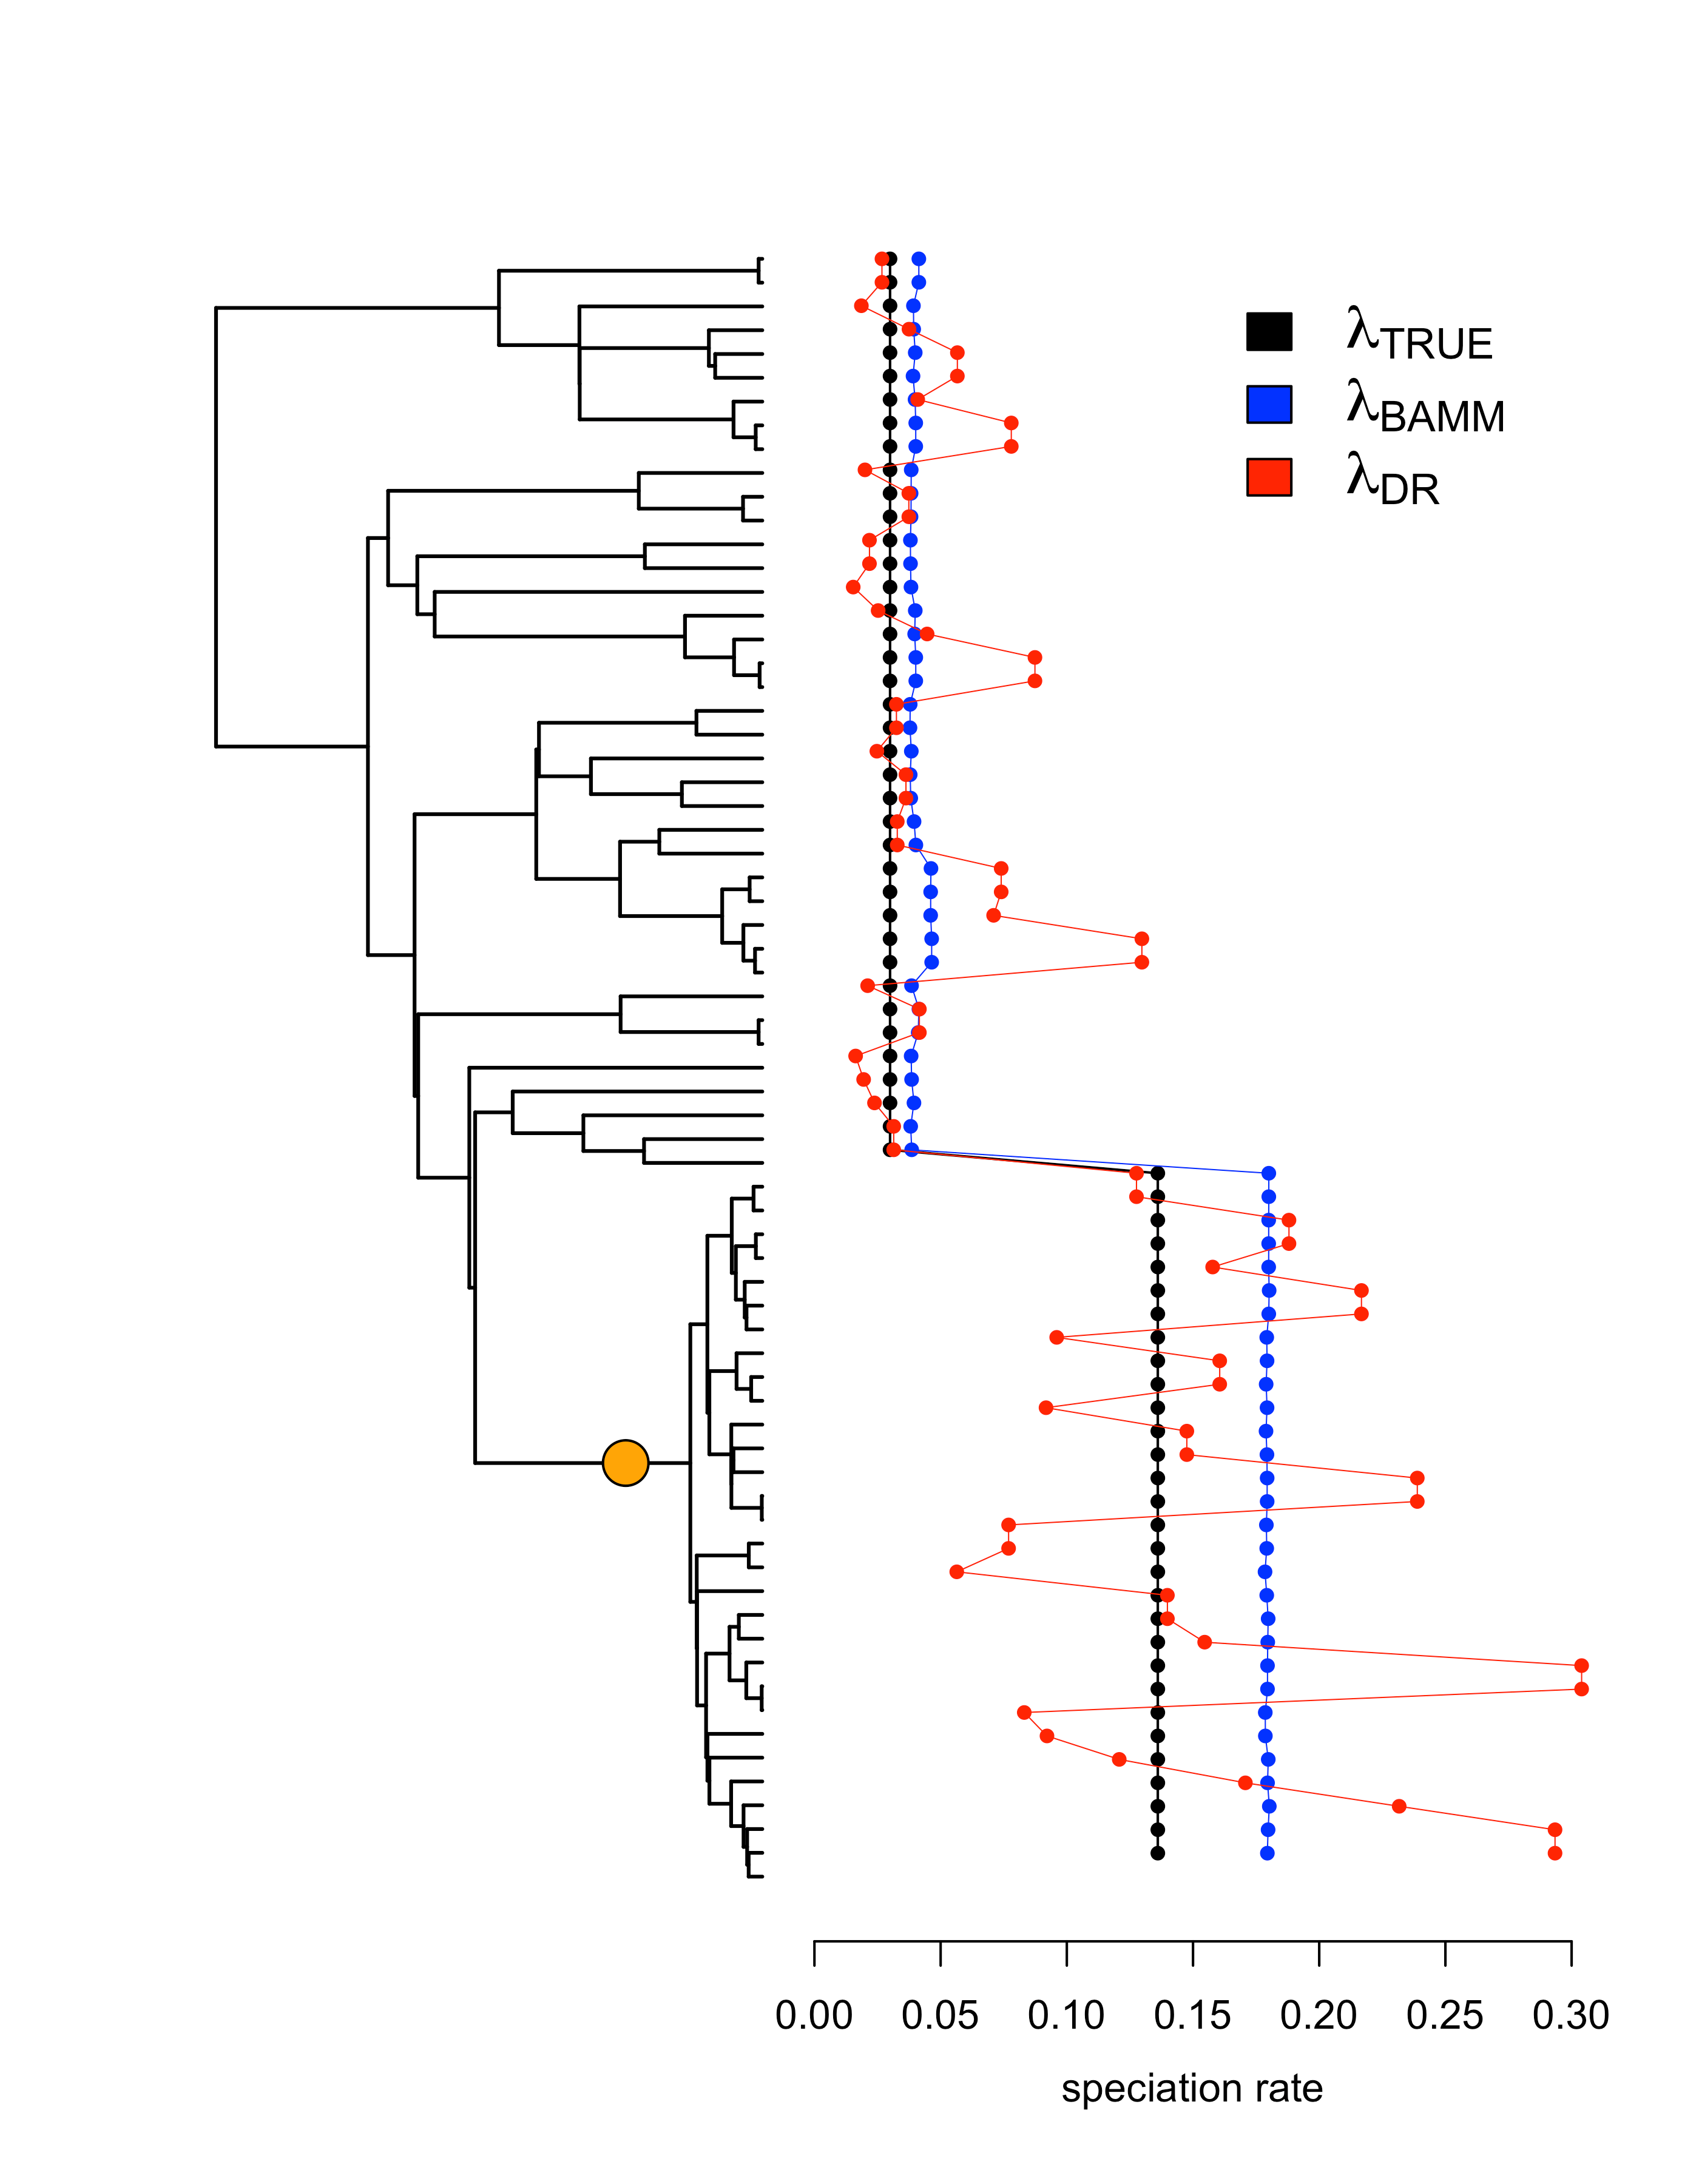
The best way to show this visually is with a simple example of a simulated phylogeny with a single shift toward a higher speciation rate. In this example (Figure 2), the signal of the rate shift in the data was enough for BAMM to identify it. Although DR generally tracks the shift to greater rates of speciation, the corresponding variance of the estimator is so high that we observe low accuracy overall.
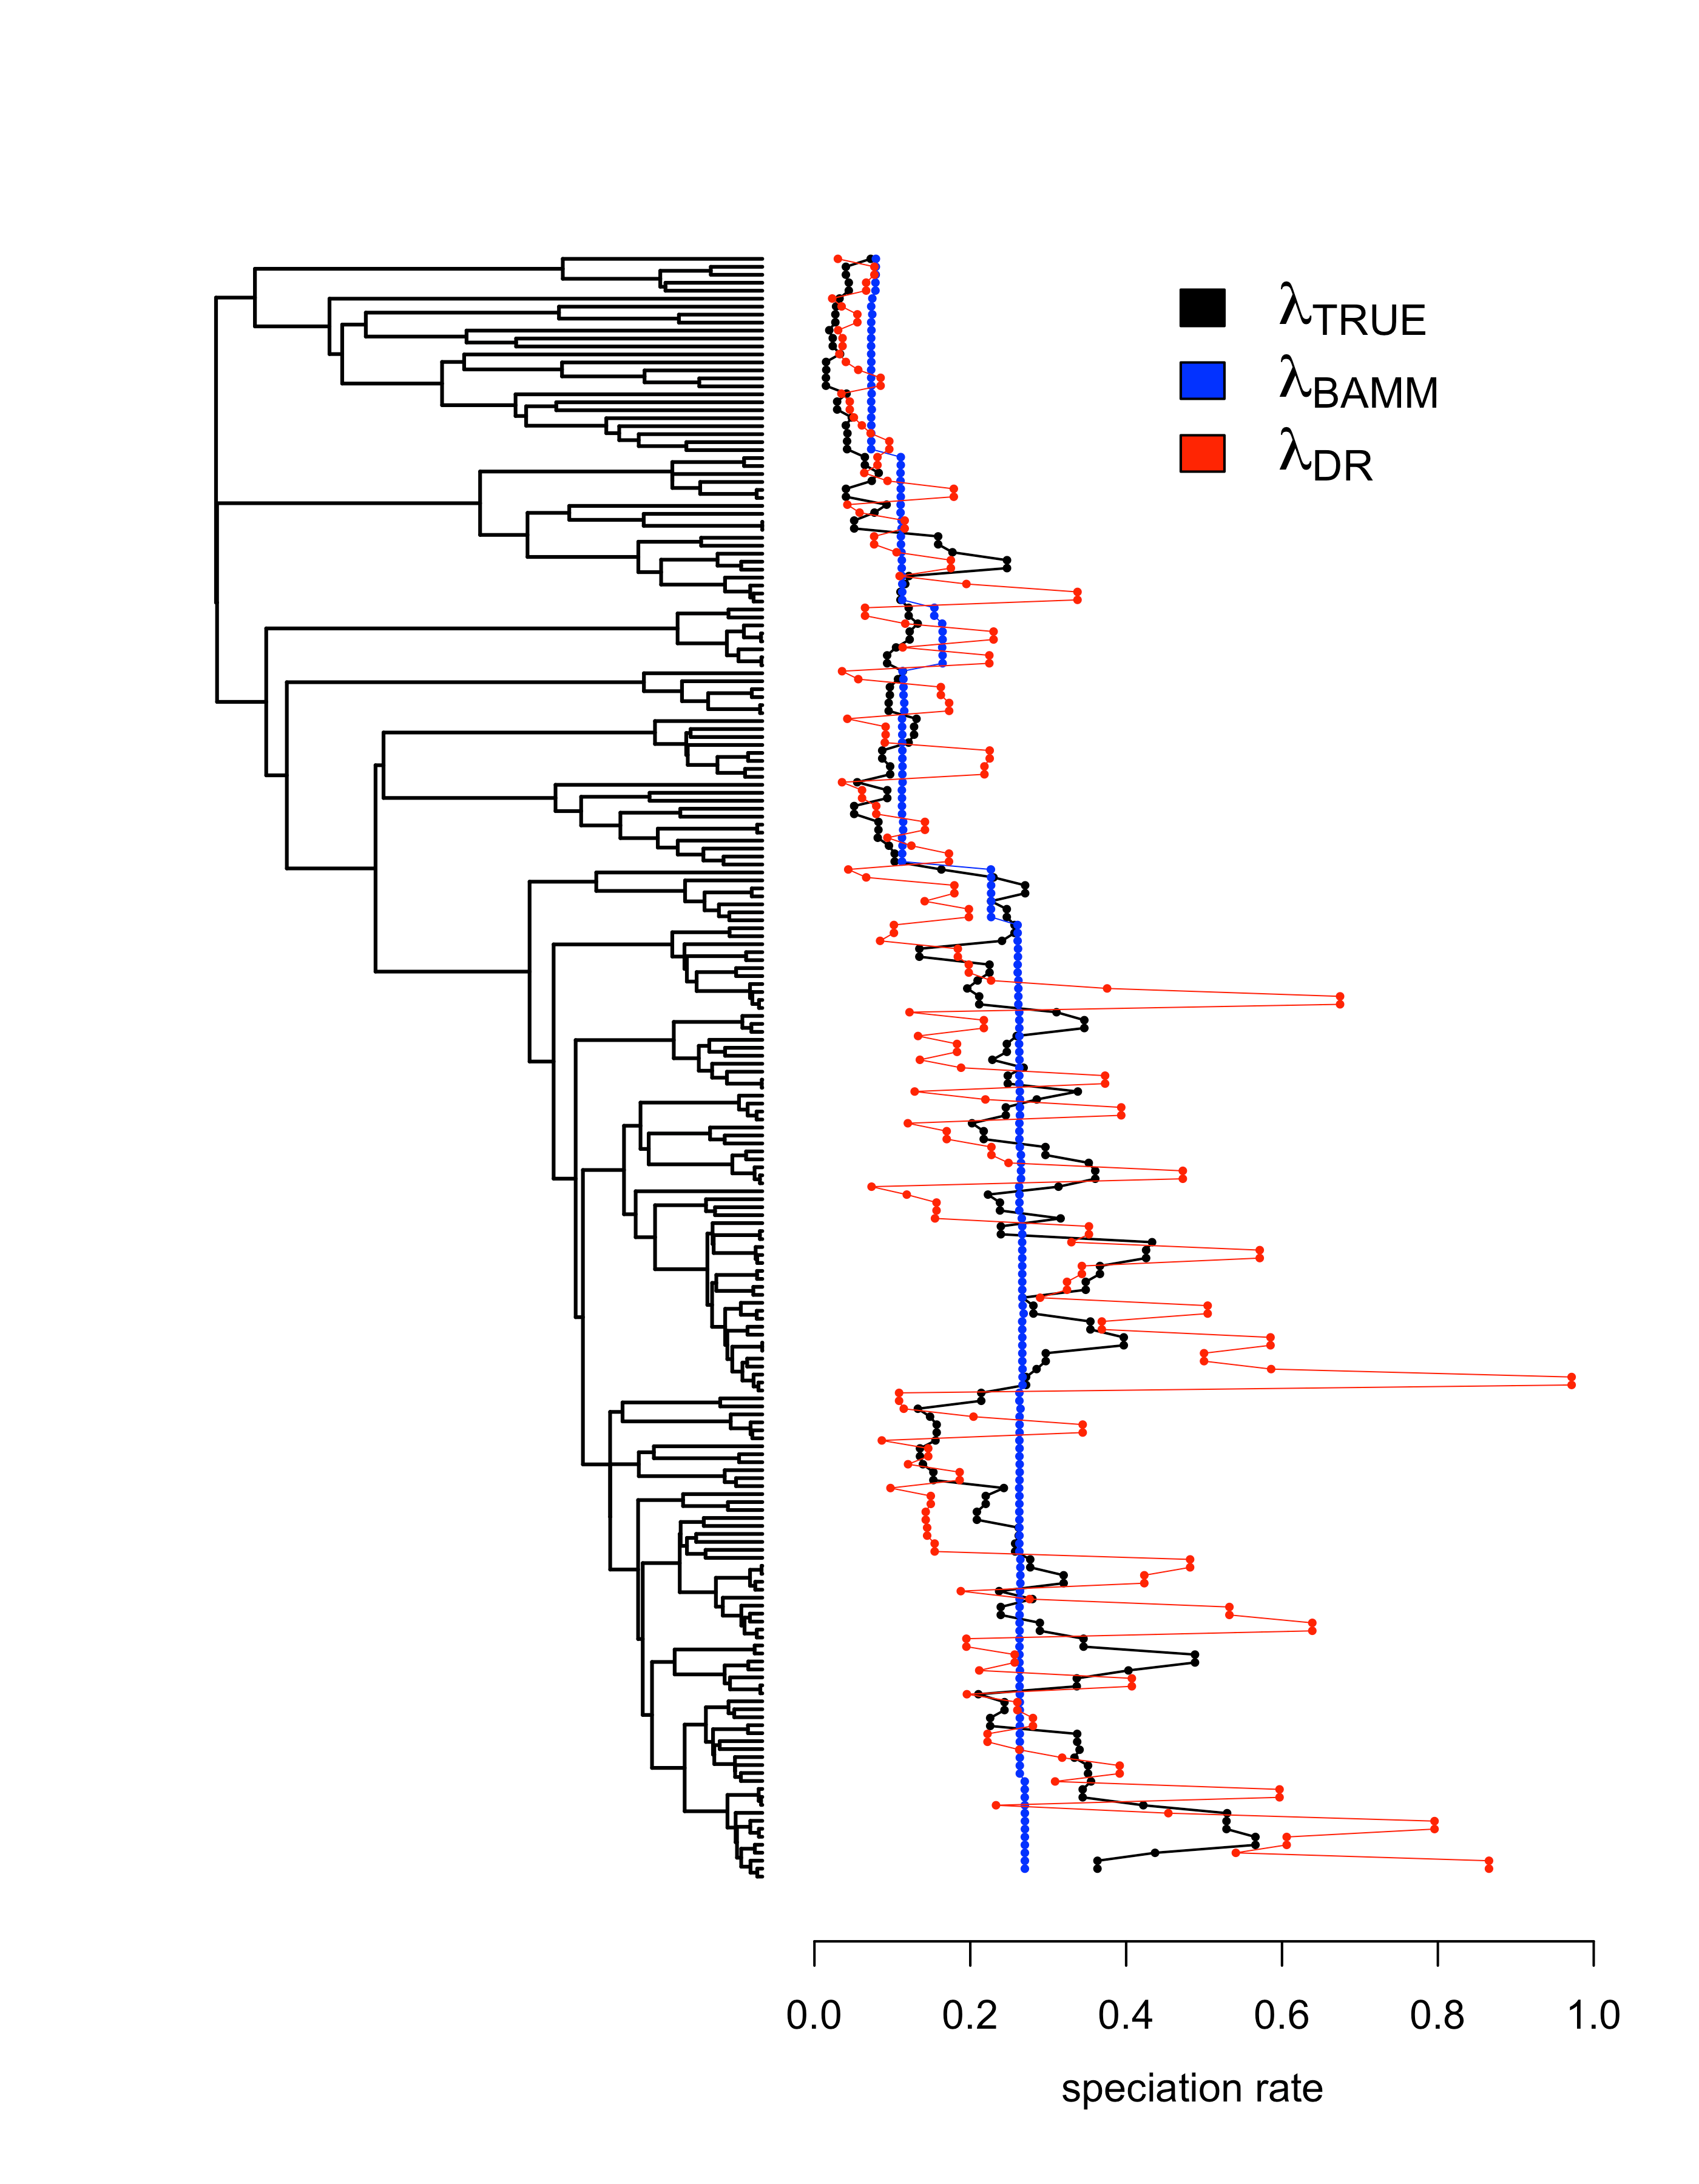
We also performed analyses on several datasets where the rate of speciation varies continuously according to a diffusion process. This model is quite different from the discrete rate shifts model found in BAMM. So you might expect that model-free tip rate metrics that don’t rely on a particular model might do better at tracking continuously varying speciation rates. But we found that the discrete rate shifts that BAMM identifies as it tries to accommodate the continuous rate variation lead to more accurate tip rates than the DR statistic (Figure 3). Once again, DR successfully tracks trends in speciation rates, but its variance is quite high.
Final Thoughts
Tip rate metrics provide a conceptually appealing and practical approach for studying rate heterogeneity across phylogenies. They’re particularly useful when it comes to summarising diversification rates across geographic space or when you’re testing for trait-dependent diversification.
Caution must be used when interpreting tip rates though (e.g., DR is not a valid measure of net diversification rate, but performs well as a measure of speciation rate). In addition, our tests using simulated phylogenies revealed that BAMM is more accurate than any of the model-free metrics we explored, even when the simulation model departs from the inference model that BAMM is based on. This performance advantage is largely driven by BAMM’s conservative placement of rate shifts, as compared to DR’s high variance in tip rates.
To find out more read our full Methods in Ecology and Evolution article ‘Tip rates, phylogenies and diversification: What are we estimating, and how good are the estimates?’

One thought on “Phylogenetic Tip Rates: How Well Can We Estimate Diversification?”