Quantifying animal movement is central to research spanning a variety of topics. It’s an important area of study for behavioural ecologists, evolutionary biologists, ecotoxicologists and many more. There are a lot of ways to track animals, but they’re often difficult, especially for people who don’t have a strong background in programming. Vivek Hari Sridhar, Dominique G. Roche and Simon Gingins have developed a new, simple software to … Continue reading Quantifying Animal Movement from Videos
Modelling species distributions involves relating a set of species occurrences to relevant environmental variables. An important step in this process is assessing how good your model is at figuring out where your target species is. We generally do this by evaluating the predictions made for a set of locations that aren’t included in the model fitting process (the ‘testing points’).
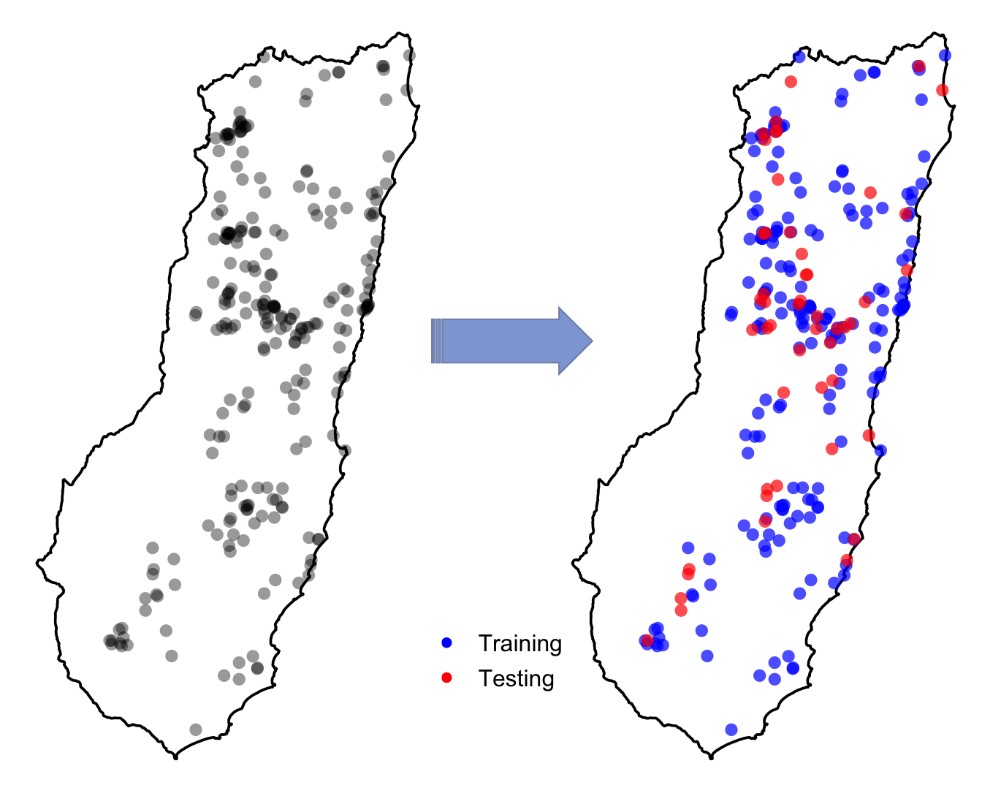
Random splitting of the species occurrence data into training and testing points
The normal, practical advice people give about this suggests that, for reliable validation, the testing points should be independent of the points used to train the model. But, truly independent data are often not available. Instead, modellers usually split their data into a training set (for model fitting) and a testing set (for model validation), and this can be done to produce multiple splits (e.g. for cross-validation). The splitting is typically done randomly. So testing points sometimes end up located close to training points. You can see this in the figure to the right: the testing points are in red and training points are in blue. But, could this cause any problem? Continue reading “Spatial Cross-Validation of Species Distribution Models in R: Introducing the blockCV Package”
مدلسازی توزیع گونهها به تخمین و برآورد ارتباط بین مجموعهای از نقاط حضور گونه با متغیرهای زیستمحیطی مرتبط می پردازد. یکی از مراحل اساسی این فرایند، ارزیابی قدرت مدل برای پیشبینی مکانهایی است که احتمال حضورگونه در آنجا وجود دارد. این کار اغلب با ارزیابی پیشبینی انجام شده در مجموعهای ازنقاط که در فرآیند مدلسازی مورد استفاده قرار نگرفته اند (نقاط آزمایشی) صورت میگیرد.
تقسیم تصادفی دادههای حضور گونه به نقاط آزمایشی و آموزشی
مطالعات پیشین بر این نکته تاکید دارند که به منظور ارزیابی معتبر، نقاط آزمایشی باید مستقل از نقاط آموزشی باشند، این درحالیست که داده مستقل واقعی به ندرت در دسترس می باشد. به همین دلیل، در فرایند مدلسازی معمولا دادههای موجود را به دو قسمت دادههای آموزشی (برای کالیبره کردن مدل) و داده های آزمایشی (برای ارزیابی دقت مدل) تقسیم میکنند، این استراتژی میتواند چند قسمتی هم باشد (برای مثال اعتبارسنجی متقاطع یا cross-validation). از آنجاییکه این تقسیم بندی معمولا بصورت تصادفی انجام میشود، بنابراین گاهی اوقات نقاط آزمایشی در فواصل نزدیک به نقاط آموزشی قرار میگیرند. شکل زیر این مساله را به خوبی نشان می دهد که در آن نقاط آزمایشی به رنگ قرمز و نقاط آموزشی آبی هستند. اما آیا این مساله میتواند مشکلی ایجاد کند؟ Continue reading “اعتبارسنجی متقاطع مکانی در مدلسازی توزیع گونهها”
‘babette‘ is an R package that works with the popular phylogenetic tool BEAST2. BEAST2 uses one or more alignments and a model setup to create a Bayesian posterior of jointly estimated model parameters and phylogenies.
babette lets you call BEAST2 from an R script. This makes it easier to explore models and/or alignments than using the graphical user interface programs that BEAST2 provides. It will also help you to improve the reproducibility of your work with BEAST2.
babette Tutorial Videos
If you’re new to phylogentic analyses, the video ‘babette demo‘ demonstrates the package. It has all of the information that you need to be able to start using the package
The Global Pollen Project is an online, freely available tool and data source developed to help people identify and disseminate palynological resources. Palynology – the study of pollen grains and other spores – is used across many fields of study including modern and fossil vegetation dynamics, forensic sciences, pollination, and beekeeping. To help make pollen identification quicker and more transparent, we developed the Global Pollen Project (GPP) – an open, peer-reviewed database of global pollen morphology, where content and expertise is crowdsourced from across the world. Our approach to developing this tool was open: open code, open data, open access. It connects to other data services, including the Global Biodiversity Information Facility and Neotoma Palaeoecology Database, to provide occurrence data for each taxon, alongside pollen images and metadata. Continue reading “The Global Pollen Project: An Update for Methods Readers”
I was really happy to hear that our paper, ‘HistMapR: Rapid digitization of historical land‐use maps in R’ was shortlisted for the 2017 Robert May Prize, and to be asked to write a blog to mark the occasion. The paper was already recommended in an earlier blog post by Sarah Goslee (the Associate Editor who took care of our submission), and described by me in an instructional video, so I thought that I would write the story of our first foray into making an R package, and submitting a paper to a journal that I never thought I would ever get published in.
Background: Changing Land-Use and Digitizing Maps
Land-use change in Europe is often typified by land-drainage to create arable fields.
Land-use change is largely accepted to be one of the major threats to biodiversity worldwide at the moment. At the same time, a warming climate means that species’ ranges need to move poleward – something that can be hampered by changing land use. Quantifying how land use has changed in the past can help us to understand how species diversity and distributions respond to environmental change.
Unfortunately, quantifying this change by digitizing historical maps is a pretty tedious business. It involves a lot of clicking around various landscape features in a desktop GIS program. So, in many cases, historical land use is only analyzed in a relatively small number of selected landscapes for each particular study. In our group at Stockholm University, we thought that it would be useful to digitize maps over much larger areas, making it possible to assess change in all types of landscape and assess biodiversity responses to land-use change at macroecological scales. The question was, how could we do this? Continue reading “HistMapR: 12 Months from Coffee Break Musings to a Debut R Package”
In reality, code is often poorly commented (or not commented at all!), hard to reuse for other projects, and difficult to interpret. To add to that, most code isn’t actively maintained, so users are on their own if they try to commandeer it for new purposes. Further, ecologists with little or no programming knowledge are unlikely to benefit from methods that exist only as poorly documented code. In a positive development, some new methods are accessible through software with graphic user interfaces (GUIs) developed by programmers spending significant time and effort. But too often these end up as tools with flashy controls and insufficient instruction manuals. Continue reading “Code-Based Methods and the Problem of Accessibility”