My Entropy ‘Pearl’: Using Turing’s Insight to Find an Optimal Estimator for Shannon Entropy

Post provided by Anne Chao (National Tsing Hua University, Taiwan)

Shannon Entropy

Not quite as precious as my entropy pearl
Not quite as precious as my entropy pearl ©Amboo Who

Ludwig Boltzmann (1844-1906) introduced the modern formula for entropy in statistical mechanics in 1870s. Since its generalization by Claude E. Shannon in his pioneering 1948 paper A Mathematical Theory of Communication, this entropy became known as ‘Shannon entropy’.

Shannon entropy and its exponential have been extensively used to characterize uncertainty, diversity and information-related quantities in ecology, genetics, information theory, computer science and many other fields. Its mathematical expression is given in the figure below.

In the 1950s Shannon entropy was adopted by ecologists as a diversity measure. It’s interpreted as a measure of the uncertainty in the species identity of an individual randomly selected from a community. A higher degree of uncertainty means greater diversity in the community.

Unlike species richness which gives equal weight to all species, or the Gini-Simpson index that gives more weight to individuals of abundant species, Shannon entropy and its exponential (“the effective number of common species” or diversity of order one) are the only standard frequency-sensitive complexity measures that weigh species in proportion to their population abundances. To put it simply: it treats all individuals equally. This is the most natural weighing for many applications. Continue reading “My Entropy ‘Pearl’: Using Turing’s Insight to Find an Optimal Estimator for Shannon Entropy”

Issue 7.1

Issue 7.1 is now online!

The January issue of Methods is now online!

As always, the first issue of the year is our sample issue. You can access all of the articles online free of charge. No subscription or membership is required!

We have two Open Access articles and two Applications papers in our January issue.

Recognizing False Positives: Environmental DNA (eDNA) is increasingly used for surveillance and detection of species of interest in aquatic and soil samples. A significant risk associated with eDNA methods is potential false-positive results due to laboratory contamination. To minimize and quantify this risk, Chris Wilson et al. designed and validated a set of synthetic oligonucleotides for use as species-specific positive PCR controls for several high-profile aquatic invasive species.

BiMat: An open-source MATLAB package for the study of the structure of bipartite ecological networks. BiMat enables both multiscale analysis of the structure of a bipartite ecological network – spanning global (i.e. entire network) to local (i.e. module-level) scales – and meta-analyses of many bipartite networks simultaneously. The authors have chosen to make this Applications article Open Access.

Gemma Murray et al. provide this month’s second Open Access article. In ‘The effect of genetic structure on molecular dating and tests for temporal signal‘ the authors use simulated data to investigate the performance of several tests of temporal signal, including some recently suggested modifications. The article shows that all of the standard tests of temporal signal are seriously misleading for data where temporal and genetic structures are confounded (i.e. where closely related sequences are more likely to have been sampled at similar times). This is not an artifact of genetic structure or tree shape per se, and can arise even when sequences have measurably evolved during the sampling period.

Our January issue also features articles on Monitoring, Population Ecology, Genetics, Evolution, Community Ecology, Diversity and more. Continue reading “Issue 7.1”

Introducing Biodiverse: Phylodiversity Made Easy

Post provided by SHAWN LAFFAN and ANDREW THORNHILL

© Shawn Laffan
© Shawn Laffan

Phylodiversity indices are increasingly used in spatial analyses of biodiversity, driven largely by the increased availability of phylogenetic trees and the tools to analyse them. Such analyses are integral to understanding evolutionary history and deciding where to allocate conservation resources.

Phylogenetic Indices: The Current Favourites

The most commonly used phylogenetic index is Faith’s Phylogenetic Diversity (PD; Faith 1992). PD is the phylogenetic analogue of taxon richness and is expressed as the number of tree units which are found in a sample.

More recently developed phylodiversity indices adapt the calculation of PD by adjusting the branch lengths of a sample using the local lineage range sizes and abundances, for example Phylogenetic Endemism (PE) and Abundance weighted Evolutionary Diversity (AEDt). In PE the length of each branch in a sample is multiplied by the fraction of its total geographic range found in that sample. The AEDt index uses the same general approach, but weights each branch by the fraction of total abundances found in the sample. The weighting process is generic, so one can scale the branch lengths by any relevant factor, for example the threat status (Faith 2015). Continue reading “Introducing Biodiverse: Phylodiversity Made Easy”

Issue 6.12

Issue 6.12 is now online!

The December issue of Methods is now online! 

Our final issue of 2015 contains one Applications article and two Open Access articles, all of which are freely available.

stagePOP: A tool for predicting the deterministic dynamics and interactions of stage-structured populations (i.e. where the life cycle consists of distinct stages, for example eggs, juveniles and reproductive adults). The continuous-time formulation enables stagePop to easily simulate time-varying stage durations, overlapping generations and density-dependent vital rates.

Julia Cherry et al. provide one of this month’s Open Access articles. In ‘Testing sea-level rise impacts in tidal wetlands: a novel in situ approach‘ the authors describe the use of experimental weirs that manipulate water levels to test sea-level rise impacts in situ and at larger spatial scales. This new method can provide more robust estimates of sea-level rise impacts on tidal wetland processes. This article was accompanied by a press release when it was published in Early View. You can read more about this article here.

Our September issue also features articles on Biodiversity, Demography, Predator-Prey Interactions, Animal Communication and much more. Continue reading “Issue 6.12”

Building a Better Indicator

Post Provided by Charlie Outhwaite & Nick Isaac

Nick and Charlie are giving a presentation on ‘Biodiversity Indicators from Occurrence Records’ at the BES Annual Meeting on Wednesday 16 December at 13:30 in Moorfoot Hall. Charlie will also be presenting a poster on Tuesday 15 December between 17:00 and 18:30 on ‘Monitoring the UK’s less well-studied species using biological records‘ in the Lennox Suite.

Biodiversity Indicators are some of the most important tools linking ecological data with government policy. Indicators need to summarise large amounts of information in a format that is accessible to politicians and the general public. The primary use of indicators is to monitor progress towards environmental targets. For the UK, a suite of indicators are produced annually which are used to monitor progress towards the Aichi targets of the Convention on Biological Diversity as well as for European Union based commitments.  However, this is complicated by the fact that biodiversity policy within the UK is devolved to each of the four nations, so additional indicators have been developed to monitor the commitments of each country.

© Dave Colliers
© Dave Colliers

A range of biodiversity indicators exist within this suite covering the five strategic goals of the Convention; which include addressing the causes of biodiversity loss, reducing pressures on biodiversity and improving status of biodiversity within the UK. Within strategic goal C (improve status of biodiversity by safeguarding ecosystems, species and genetic diversity) there are currently 11 “State” indicators that use species data to monitor progress towards the targets underlying this goal. Most existing species based indicators use abundance data from large scale monitoring schemes with systematic protocols. However, there are other sources of data, such as occurrence records, that can offer an alternative if they are analysed using the appropriate methods. This post will discuss the development of species indicators for occurrence records to complement the current UK species based indicators, specifically relating to the C4b priority species indicator and the D1c pollinators indicator. Continue reading “Building a Better Indicator”

Making the Most of Volunteer Data: Counting the birds and more…

Post provided by Rob Robinson

It’s 6am on a warm spring morning and I’m about to visit the second of my Breeding Bird Survey1 sites. Like 2,500 other volunteers in the UK, twice a year I get up early to record all the birds I see or hear on the two transects in my randomly selected 1km square. Each year I look forward to these mornings almost as much for the comparisons as the actual sightings. Will there be more or fewer sightings of our summer migrants this year? How will numbers in this rolling Norfolk farmland stack up against those I see in urban, central Norwich?

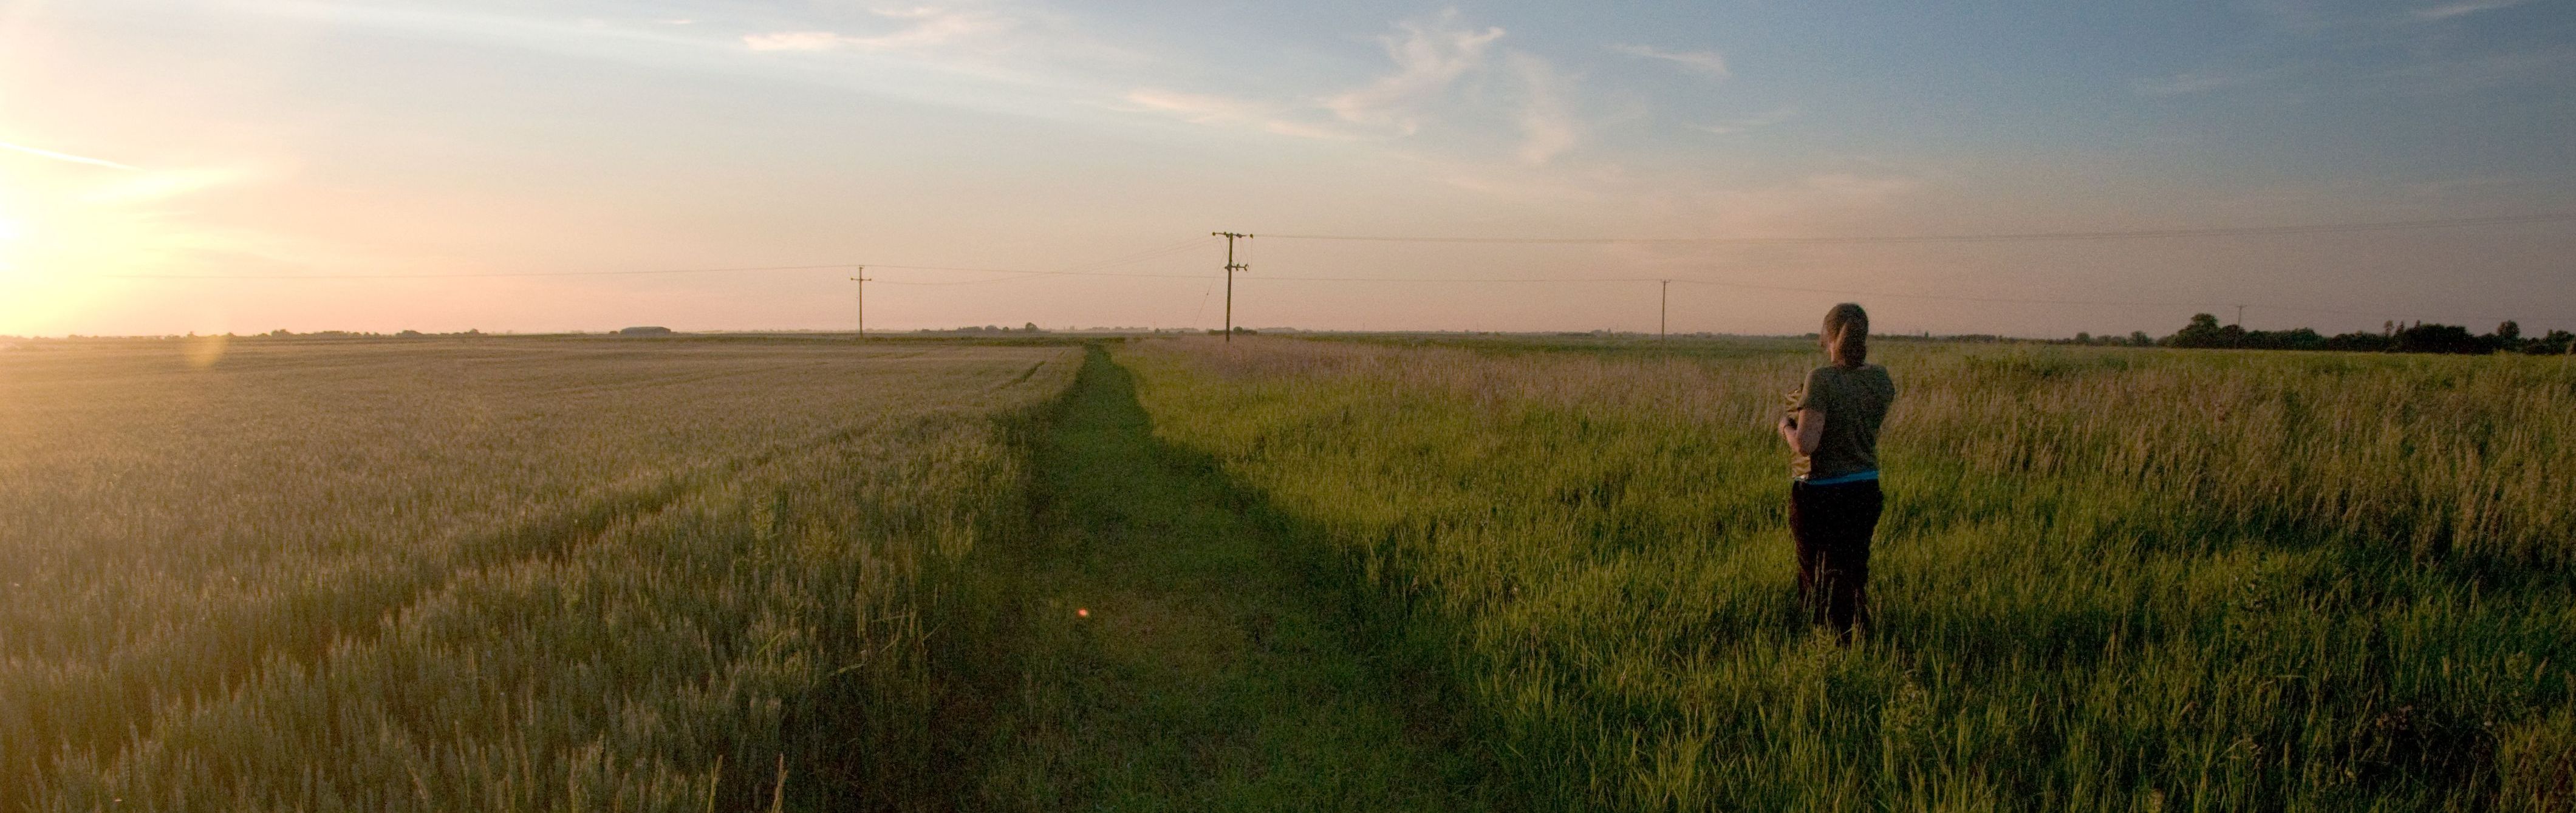
Dawn bird survey in arable farmland. © Rob Robinson/BTO
Dawn bird survey in arable farmland. © Rob Robinson/British Trust for Ornithology (BTO)

The importance of demography

But simply recording these changes is not enough; we need to understand why they occur if action is to be taken. This requires us to quantify the demographic rates (survival, productivity and movements) that underlie them, which in turn requires samples of marked individuals. Simply counting individuals is not enough. Continue reading “Making the Most of Volunteer Data: Counting the birds and more…”

New Associate Editors

Over the next few weeks we will be welcoming three new Associate Editors to Methods in Ecology and Evolution. Susan Johnston (University of Edinburgh, UK) became a member of the Associate Editor Board on Monday 5 October. She will be joined on 19 October by Natalie Cooper (Natural History Museum, London, UK) and finally by Luísa Carvalheiro (University of Brasília, Brazil) on 2 November. You can find out … Continue reading New Associate Editors

Issue 6.9

Issue 6.9 is now online!

The September issue of Methods is now online!

This month’s issue contains one Applications article and two Open Access articles, all of which are freely available.

POPART: An integrated software package that provides a comprehensive implementation of haplotype network methods, phylogeographic visualisation tools and standard statistical tests, together with publication-ready figure production. The package also provides a platform for the implementation and distribution of new network-based methods.

Michalis Vardakis et al. provide this month’s first Open Access article. In ‘Discrete choice modelling of natal dispersal: ‘Choosing’ where to breed from a finite set of available areas‘ the authors show how the dispersal discrete choice model can be used for analysing natal dispersal data in patchy environments given that the natal and the breeding area of the disperser are observed. This model can be used for any species or system that uses some form of discrete breeding location or a certain degree of discretization can be applied.

Our September issue also features articles on Animal Movement, Population Dynamics, Statistical Ecology, Biodiversity, Conservation Biology and much more. Continue reading “Issue 6.9”

National Wildlife Day 2015

Happy National Wildlife Day everyone!

Today is 10th National Wildlife Day. As we have done for a few awareness days this year (Bats, Biodiversity and Bees so far) we are marking the day by highlighting some of our favourite Methods in Ecology and Evolution articles on the subject. Obviously ‘wildlife’ is a pretty big topic, so we have narrowed our focus (slightly) to monitoring wildlife (with one or two additional papers that we didn’t want to leave out).

This list is certainly not exhaustive and there are many more wonderful articles on these topics in the journal. You can see more of them on the Wiley Online Library.

If you would like to learn more about National Wildlife Day, you may wish to visit the organisation’s website, follow them on Twitter and Facebook or check out today’s hashtag: #NationalWildlifeDay.

Without further ado though, please enjoy our selection of Methods articles for National Wildlife Day:

Integrating Demographic Data

Our National Wildlife Day celebration begins with an article from our EURING Special Feature. Robert Robinson et al. present an approach which allows important demographic parameters to be identified, even if they are not measured directly, in ‘Integrating demographic data: towards a framework for monitoring wildlife populations at large spatial scales‘. Using their approach they were able to retrieve known demographic signals both within and across species and identify the demographic causes of population decline in Song Thrush and Lawping.


Continue reading “National Wildlife Day 2015”

National Honey Bee Day 2015

Happy National Honey Bee Day everyone!

As you may know, tomorrow (Saturday 22 August) is National Honey Bee Day in the USA. To mark the day we will be highlighting some of the best papers that have been published on bees and pollinators in Methods in Ecology and Evolution.

You can find out more about National Honey Bee Day (and about bees in general) HERE.

Without further ado though, here are a few of the best Methods papers related to Honey Bees:

Wildebeast graze on the cover of MEE 2.5Honey Bee Risk Assessment

Our Honey Bee highlights begin with Hendriksma et al.’s article ‘Honey bee risk assessment: new approaches for in vitro larvae rearing and data analyses‘. Robust laboratory methods for assessing adverse effects on honey bee brood are required for research into the issues contributing to global bee losses. To facilitate this, the authors of this article recommend in vitro rearing of larvae and suggest some appropriate statistical tools for the related data analyses. Together these methods can help to improve the quality of environmental risk assessment studies on honey bees and secure honey bee pollination. As this article was published over two years ago, it can be accessed for free by anyone.

Continue reading “National Honey Bee Day 2015”