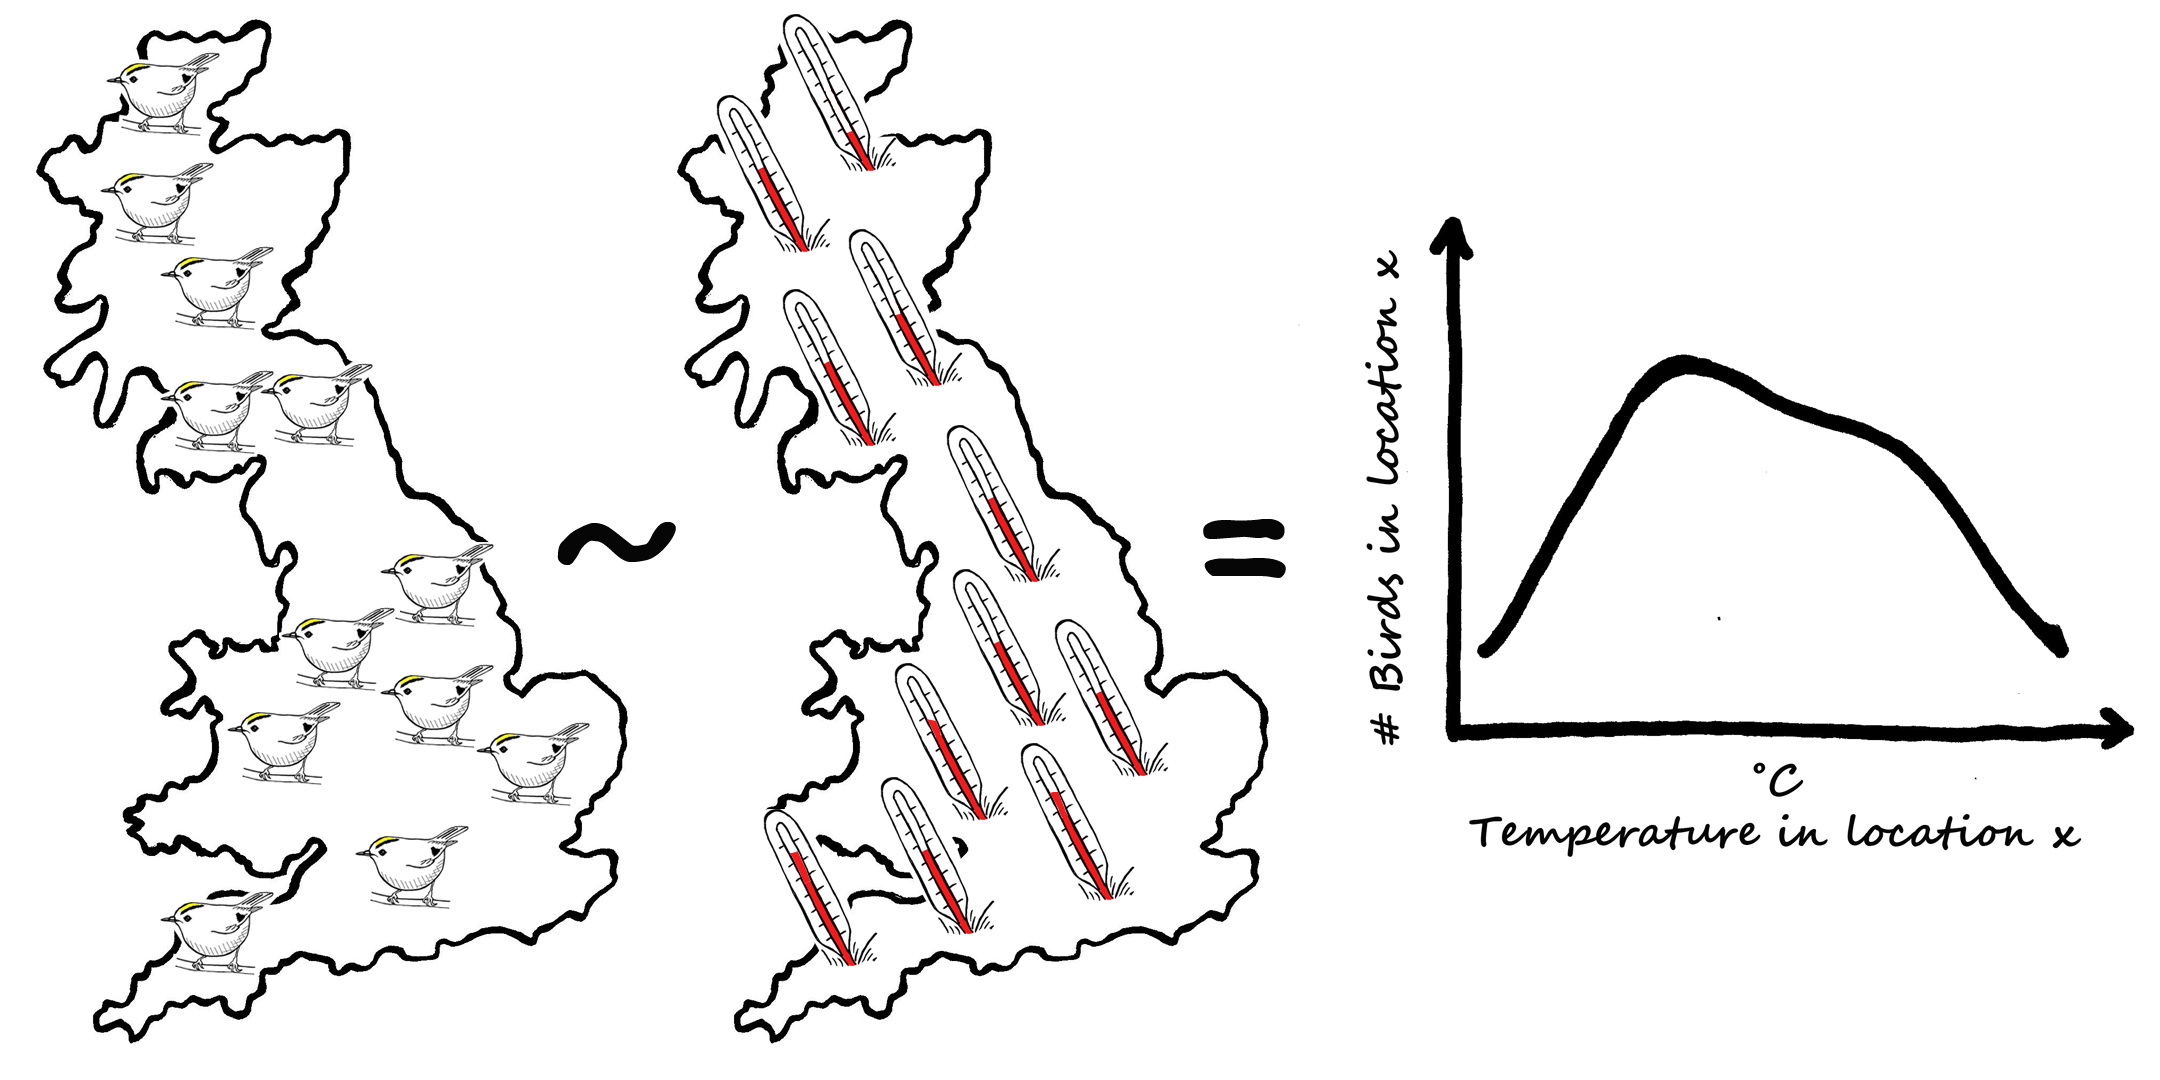
When trying to understand how wildlife, for example a bird species, may react to climate change scientists generally study how species numbers vary in relation to climatic or weather variables (e.g. Renwick et al. 2012, Johnston et al. 2013). The way this tends to be done is by gathering information (data!) about bird numbers as well as the weather variables (for example temperature) in several locations (i.e. in space) and fitting a regression model to these data to detect and illustrate how bird numbers go up or down with temperature.
Data on bird numbers and temperatures in several locations lets researchers see the relationship between the two.
This relationship is then used to forecast how bird numbers may change along with potential temperature changes in the future (i.e. in time), for example due to climate change.
Relationships between bird numbers and temperature in a given location are often used to forecast changes in bird numbers with expected changes in temperatures over time.
Britain’s smallest bird species, the goldcrest, is being hit hard by cold winters, new analysis methods developed by researchers at the University of St Andrews have revealed.
The data analysis techniques, published today in Methods in Ecology and Evolution, take a longer term view over multiple locations and for a period of several years, compared to previous studies.
The Global Pollen Project is a new, online, freely available tool developed to help people identify and disseminate palynological resources. Palynology – the study of pollen grains and other spores – is used across many fields of study modern and fossil vegetation dynamics, forensic sciences, pollination, beekeeping, and much more. This platform helps to facilitate cross/multi-disciplinary integration and discussion, outsourcing identifications, expertise and the sharing of knowledge.
Pollen’s Role in Plant Conservation
Successful conservation of rare, threatened, and valuable plants is dependent on an understanding of the threats that they face. Also, conservationists must prioritise species and populations based on their value to humans, which may be cultural, economic, medicinal, etc. The study of fossil pollen (palaeoecology), deposited through time in sediments from lakes and bogs, can help inform the debate over which species to prioritise: which are native, and when did they arrive? How did humans impact species richness? By establishing such biodiversity baselines, policymakers can make more informed value judgements over which habitats and species to conserve, especially where conservation efforts are weighted in favour of native and/or endemic flora. Continue reading “Tiny Grains, Big Data: The Global Pollen Project”
Understanding how biodiversity is distributed and its relationship with the environment is crucial for conservation assessment. It also helps us to predict impacts of environmental changes and design appropriate management plans. Biodiversity across a network of local sites is typically described using three components:
alpha (α) diversity, the average number of species in each specific site of the study area
beta (β) diversity, the difference in species composition between sites
gamma (γ) diversity, the total number of species in the study area.
Despite the many insights provided by the combination of alpha, beta and gamma diversity, the ability to describe species turnover has been limited by the fact that they do not consider more than two sites at a time. For more than two sites, the average beta diversity is typically used (multi-site measures have also been developed, but suffer shortcomings, including difficulties of interpretation). This makes it difficult for researchers to determine the likely environmental drivers of species turnover.
Rachel Carson (1940) Fish & Wildlife Service employee photo.
I can’t think of a more inspirational and influential ecologist than Rachel Carson. Nearly fifty years ago she released a book called Silent Spring, which argued that pesticides such as DDT were cascading up through food chains causing the death or sterilisation of birds and other animals. The publication of her book provoked public debate, likely in part because it was serialised in The New Yorker, and led to a paradigm shift in US and (arguably) global pest control policy.
With the full support of the scientific community to verify her facts and arguments, she was able to defeat the chemical industry’s backlash and galvanise public opinion in her favour. The 2005 Stockholm Convention, in which DDT was banned from agricultural use, would likely have never happened if it were not for her work.
“In a post-truth world where trust in the scientific process is being eroded almost daily, Rachel Carson is a perfect example of how we can speak out and be heard while still being scientists.”
Bush-crickets are a little-known group of insects that inhabit our marshes, grasslands, woods, parks and gardens. Some may be seen in the summer when they are attracted to artificial lights, but as most produce noises that are on the edge of human hearing, we know little about their status. There are suggestions that some bush-crickets may be benefiting from climate change, while others may be affected by habitat changes. But how to survey something that is difficult to see and almost impossible to hear? Continue reading “Sounding Them Out: A Unique Conservation Tool for Monitoring Bush-Crickets”
For the first time, it is possible to integrate at the global scale the results obtained with the most widely used methods to evaluate the “health” of ecosystems using lichens. This is the result of a study now published in the journal Methods in Ecology and Evolution, and represents a fundamental step for this indicator to be considered at the global scale and included in the list of indicators of the United Nations.
Lichens have long been successfully used by scientists as ecological indicators – a kind of environment health thermometer. These complex organisms – the yellow or green taints we often see on the surface of tree trunks – are very sensitive to pollution and changes in temperature and humidity. Evaluating how many lichens, of what kind, and their abundance in a certain ecosystem allows scientists to understand the impact that problems like climate change or pollution have on those ecosystems. Continue reading “Lichens and the “health” of ecosystems: we are closer to a global ecological indicator”
Climate change could cause the extinction of one in six species and change the abundance and distribution of those that remain (Urban, 2015). This doesn’t necessarily mean that one in six species in your backyard will go extinct though. Climate change impacts will vary greatly around the globe, with some regions seeing disproportionate effects.
The degree to which climate change will affect species in your region depends on many factors (e.g., land use and species traits), but the amount of climate change that species experience in your region – known as climate change exposure – will certainly be important. For that reason, measuring and mapping climate change exposure is critical for predicting where climate change will have the biggest impacts. Yet, biologists have no agreed upon method to measure exposure and different methods can produce dramatically different results.
A Simple Measure of Exposure and its Limitations
Climate can be defined as a statistical description of weather (e.g., temperature, precipitation) over the course of a long time period, usually 30 years. Most often climate is reduced to the average value of a particular weather variable over a 30-year period of interest. Climate change is then measured as the difference between the averages in two time periods; say the predicted average between 2070-2099 minus the average between 1971-2000.
Projected changes in annual average temperature between 1971-2000 and 2070-2099.
For example, the map to the left shows projected exposure to changes in average annual temperature. This map suggests that species in the arctic will be exposed to the most temperature change while species in the southern hemisphere will experience the least change. However, there are many problems with this interpretation. Continue reading “How Should Biologists Measure Climate Change?”
To truly understand how species’ distributions vary through space and time, biogeographers often have to make use of analytical techniques from a wide array of disciplines. As such, these papers cover advances in fields such as evolutionary analysis, biodiversity definitions, species distribution modelling, remote sensing and more. They also reflect the growing understanding that biogeography can include experiments and highlight the increasing number of software packages focused towards biogeography.
This Virtual Issue was compiled by Methods in Ecology and Evolution Associate Editors Pedro Peres-Neto and Will Pearse (both of whom are involved in the conference). All of the articles in this Virtual Issue are free for a limited time and we have a little bit more information about each of the papers included here: Continue reading “Biogeography Virtual Issue”
This month’s issue contains four Applications articles and two Open Access articles, all of which are freely available.
– iNEXT: The R package iNEXT (iNterpolation/EXTrapolation) provides simple functions to compute and plot the seamless rarefaction and extrapolation sampling curves for the three most widely used members of the Hill number family (species richness, Shannon diversity and Simpson diversity).
– camtrapR: A new toolbox for flexible and efficient management of data generated in camera trap-based wildlife studies. The package implements a complete workflow for processing camera trapping data.
– rotl: An R package to search and download data from the Open Tree of Life directly in R. It uses common data structures allowing researchers to take advantage of the rich set of tools and methods that are available in R to manipulate, analyse and visualize phylogenies.
– Fluctuating-temperature chamber: A design for economical, programmable fluctuating-temperature chambers based on a relatively small commercially manufactured constant temperature chamber modified with a customized, user-friendly microcontroller.