Post provided by Ditch Townsend and Robert Colwell
Different Paths to Science

DITCH: Amateur naturalists from the UK have a distinguished pedigree, from Henry Walter Bates and Marianne North, to Alfred Russel Wallace and Mary Anning. But arguably, the rise of post-war academia in the fifties displaced them from mainstream scientific discourse and discovery. Recently, there has been a resurgence of the ‘citizen scientist’, like me, in the UK and elsewhere – although the term may refer to more than one kind of beast.
To me, the ‘citizen scientist’ label feels a little patronising – conveying an image of people co-opted en masse for top-down, scientist-led, large-scale biological surveys. That said, scientist-led surveys can offer valid contributions to conservation and the documentation of the effects of climate change (among other objectives). They also engage the public (not least children) in science, although volunteers usually have an interest in natural history and science already. For me though, the real excitement comes in following a bottom-up path: making my own discoveries and approaching scientists for assistance with my projects.

ROB: I grew up on a working ranch in the Colorado mountains, surrounded on three sides by National Forest and a National Wilderness Area. My mother, an ardent amateur naturalist, taught me and my sister the local native flora and fauna and our father instilled a respect for the land in us. For my doctoral research at the University of Michigan, I studied insect biodiversity in Colorado and Costa Rica at several elevations. The challenges of estimating the number of species (species richness) and understanding why some places are species-rich and others species-poor has fascinated me ever since.
How to Tame Your Own Ecologist
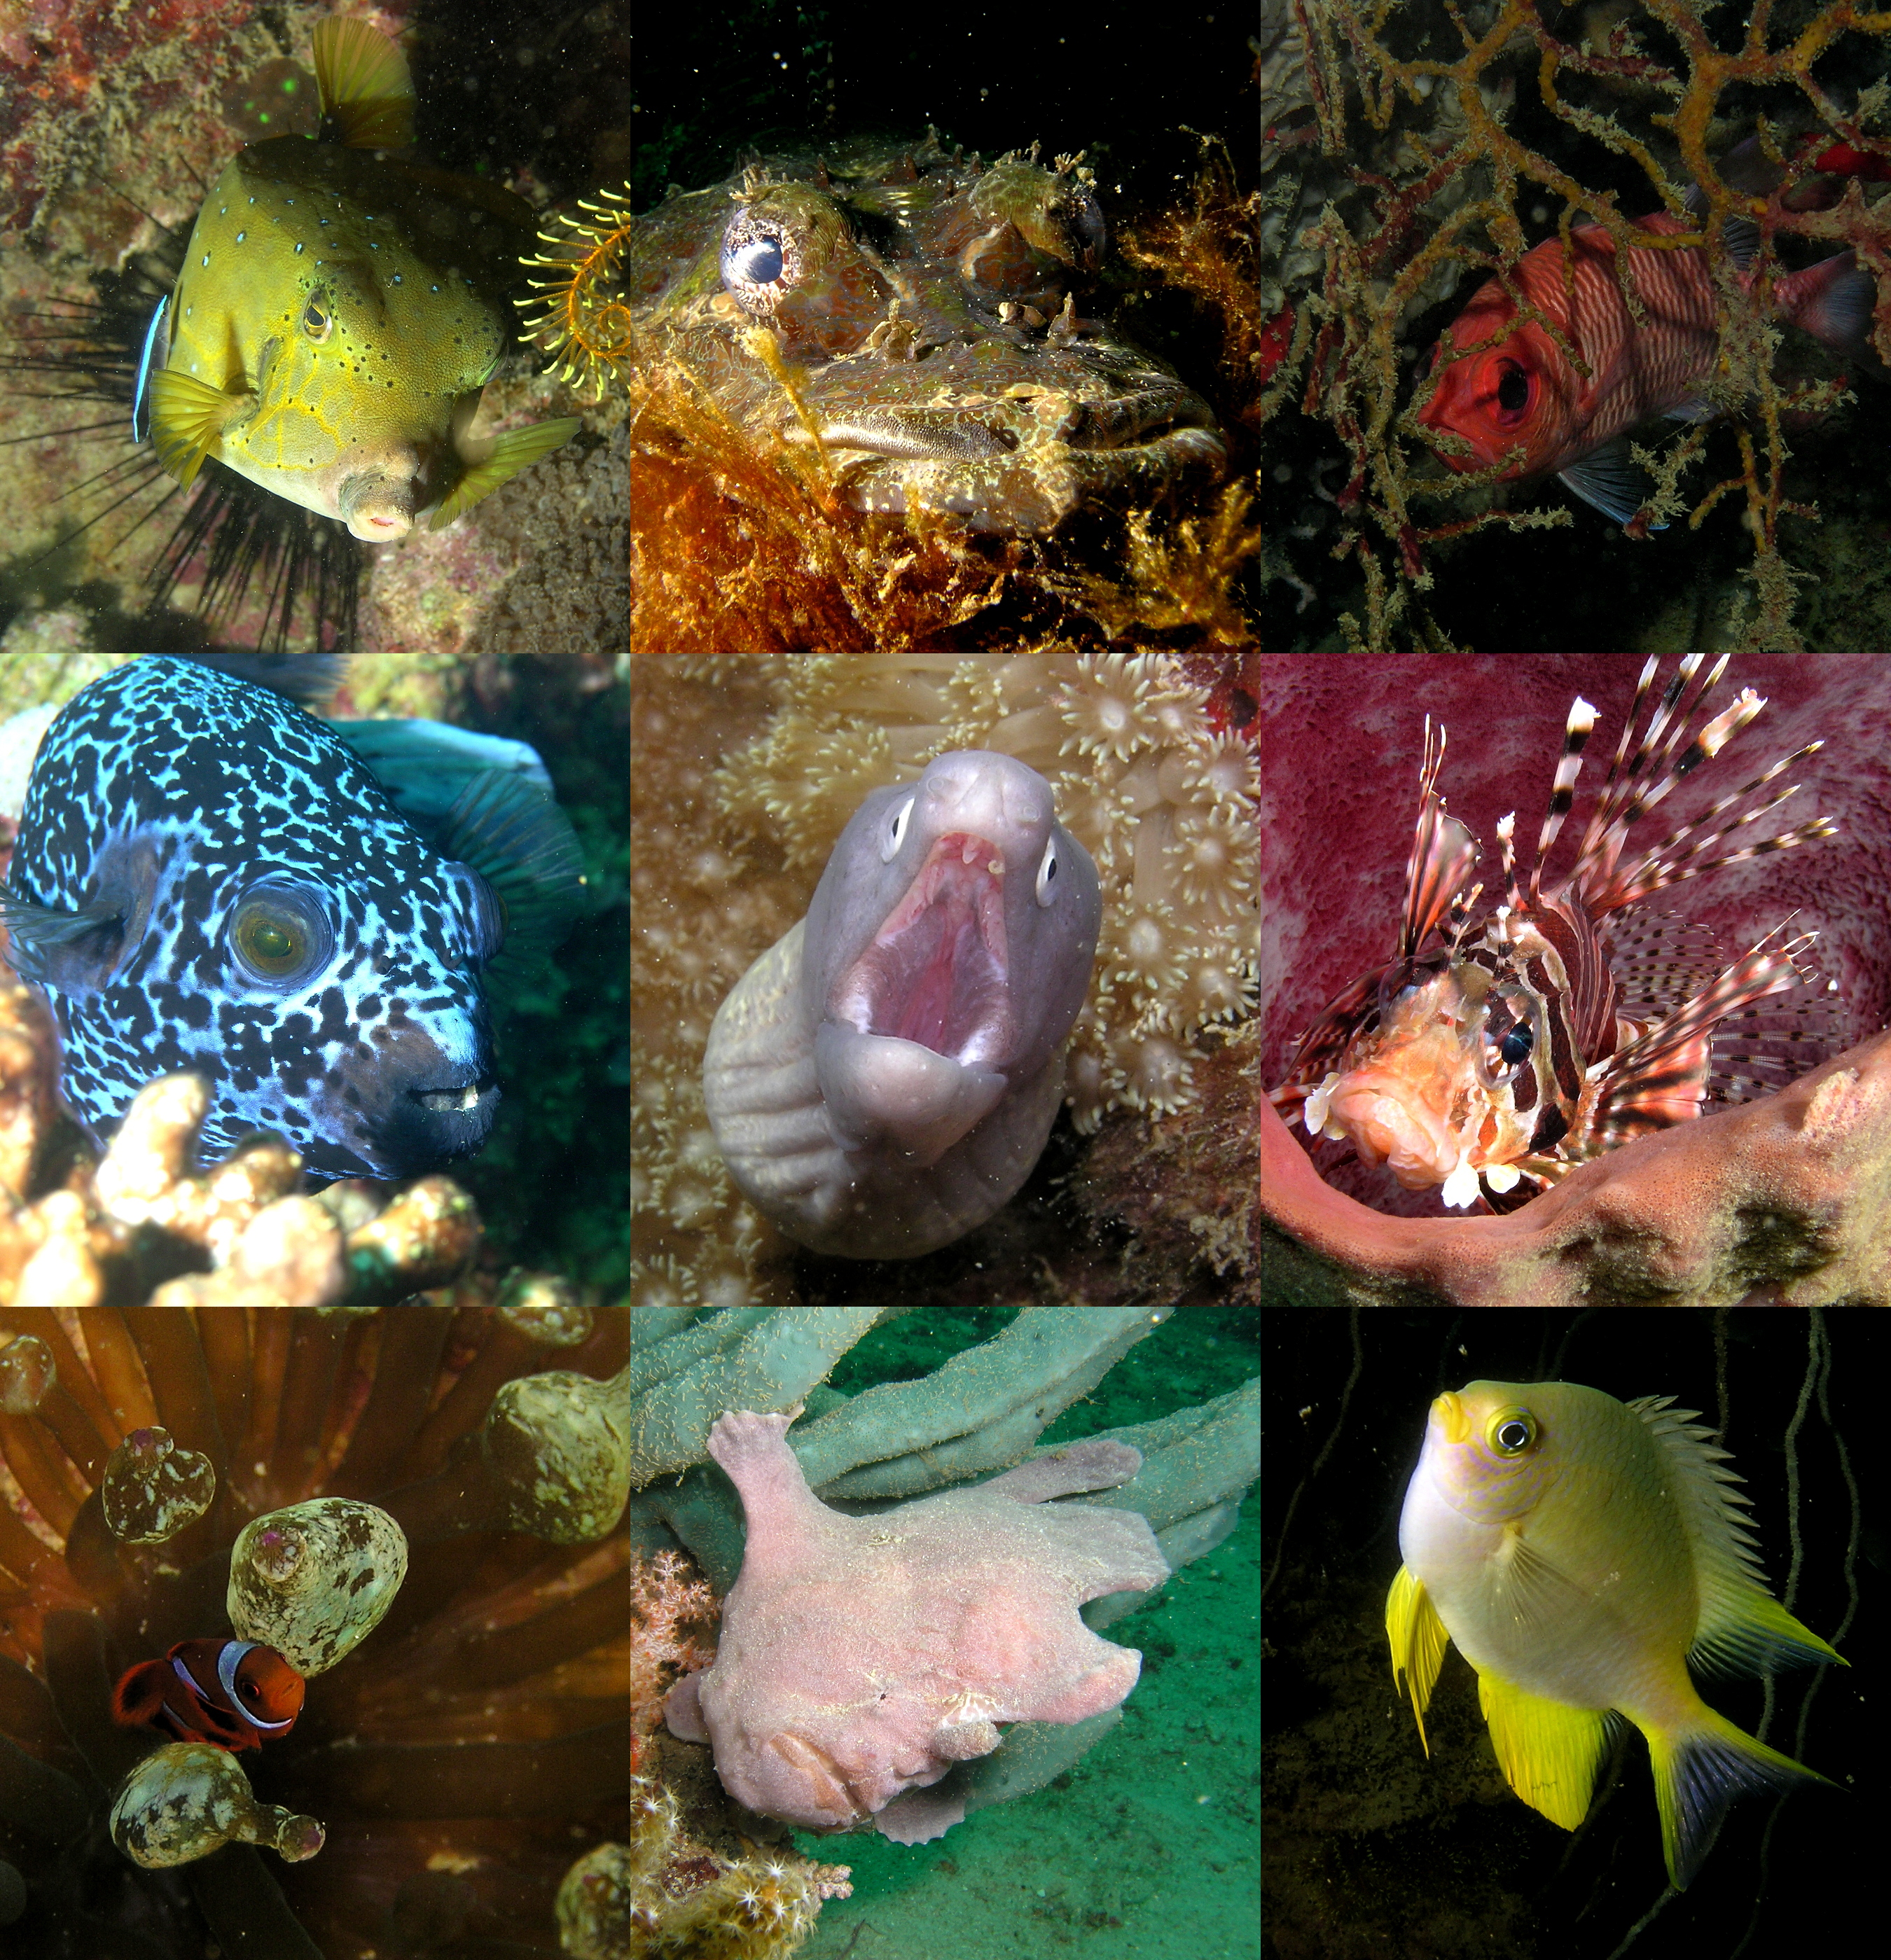
DITCH: A decade or so ago, my work in international health development took me around east Asia and the Pacific and saw my family settled in northern Borneo for three years. We had easy access to the Tunku Abdul Rahman Marine Park in the South China Sea, off Sabah. Diving is a passion of mine, not least to indulge my ichthyophilia. Just like the better-known ‘birder’, I photograph tropical reef fish – nearly 750 species so far. I returned to the Park many times over subsequent years and developed my own simple rules for these photographs: the first time I saw a fish species new to the census (one or more individuals, in a single dive), I photographed it. If and when I saw the same species on a later dive, I photographed it again. But I saw no need to keep track of any subsequent sightings, unless there was some doubt about a later identification.
While collating my final data set from Borneo, I played about with the graphing function in my spreadsheet app. I discovered that I could almost exactly predict the final number of species I would eventually see, using only the first two thirds of my data set, by fitting a curve for accumulated number of second sightings and solving for its intersection with the accumulated number of first observations – he point where every species seen has been seen at least twice. I wondered if this was an artefact; I tried reading some scientific articles about what I discovered was called species richness. But I couldn’t get past my own ignorance.
It stood to reason that I might be able to find a tame ecologist to help me make some progress in estimating species richness, including the number of species not yet seen, from my data. I’d already had some helpful assistance to identify some of my trickier photos, from several fish taxonomists (one even assisted me in publishing a species list for my local marine park). It took a year and a half of writing occasional unsolicited emails using contact details appended to scientific articles, but at last (exactly three years ago) I piqued someone’s interest. And not just anybody, but Professor Robert Colwell, no less!
ROB: Ditch’s initial email intrigued me immediately, because it was clear that he understood the basic challenges in estimating richness from incomplete sample, and I was impressed with his original approach to it. Anne Chao’s famous richness estimators, Chao1 and Chao2, make the same assumption: the census is complete when every species seen has been seen at least twice. Ditch was disappointed that the principle behind his method was a rediscovery, but it was a clear indication of his genuine scientific intuition and quantitative reasoning to me.
Unfortunately, Chao2, the applicable estimator for presence of absence of species in repeated sampling units (dives in this case) requires not only list of species seen and a count of the number of uniques (fish species photographed only once, in Ditch’s data), but also a count of the number of species seen exactly twice—the number of duplicates. Although Ditch photographed and identified species on each second sighting, he had not kept track of which of these species were never seen a third time or many times. We invented a new term for these species, superduplicates—species seen two or more times. Ditch and I worked together for several months, attempting to find a way to compute a confidence interval for his curve-fitting estimation method, by a data randomisation approach.
Alan Turing and Anne Chao Save the Day

DITCH: It became clear that attempting to extrapolate along a mathematical curve (which I learned from Rob is called a parametric method) was going to prove fruitless. It was all very well interpolating within my curve, but my curve turned out to be non-generalisable to other datasets, and we were unable to develop a reliable confidence interval. What I lacked was a list of duplicates (species seen exactly twice). It seemed like a dead end.
What I didn’t know was that Rob had a long-standing and productive working partnership with Professor Anne Chao herself! Not only that, but Anne had been working for years on ways to apply Enigma Code-breaker Alan Turing’s mathematics to develop non-parametric richness estimators. Anne had recently succeeded in extending what she calls “Turing wisdom” to higher frequencies, beyond uniques and duplicates.
Rob wrote to Anne and suggested that this advance might offer a way to estimate the missing duplicate frequency from my superduplicates. The moment she saw this problem, she knew she wanted in. In fact, her very first email suggested the framework for the solution we have here today. But don’t be misled by its elegant simplicity – a glance at the paper and its mathematical appendices will make clear that what you see on the surface is just the tip of a deep mathematical iceberg, further supported by extensive simulations by Anne’s colleague (and our co-author) Chun-Huo Chiu.
DIY Species Richness Estimation
DITCH AND ROB: To sum up, if you are a list-based amateur naturalist, do you know which species on your local list you have seen only once? For many naturalists, that number is far easier to remember, from reviewing your list, than the number of species seen exactly twice.
With our new method, all you need to estimate local species richness (with a rigorous confidence interval), including species you have yet to see, is the number of species you have seen and the number among those that you have seen only once. Or are you a scientist (or a student) daunted by the prospect of keeping track of the precise number of species seen exactly twice, just to estimate species richness? Consider collecting much less, if you can tolerate a well-validated estimate of the number seen exactly twice, to get a total richness estimate.
In case you don’t want to use our co-author Chiu’s R-code to implement your own programme, he has created an easy-to-use, publicly accessible estimation tool for schools, citizen-scientists, and professional scientists (not least students). Anne has done the maths for two variants of the method. If you have a long-term list, based on an unknown but large number of individuals seen, all you need do is to select the ‘abundance’ data type and plug in the number of species you have seen and the number of singletons (species represented by only a single individual). If your observations are split up into ‘sampling units’ (e.g. by date or by survey, like the ‘dive units’ for Ditch’s reef fish), just select the ‘incidence’ data type and indicate how many days or surveys your data is split into.
Just a few words of caution though. Remarkable though it is for its power and simplicity, our new estimator has some sensible limitations, inherited from and identical to the limitations of Chao1 and Chao2. The total richness estimates are minimum estimates, based on the data you provide—the prediction is that, with continued sampling by the same method in the same place, your list will eventually be at least that long. As your sample increases, more information enters the estimate, and the predicted minimum may increase too, though more and more gradually. Turing and Chao’s mathematics may seem magic, but they would be the first to point out that estimates are only as good as the data that goes into them.
Our new method could lower the threshold for creating traditional citizen science projects, in which a scientist hopes to enlist the help of data-gathering citizens. In a more exciting application, citizens involved in data gathering can plug their own findings into our online tool to make their own discoveries (e.g. estimates of species richness in their own garden or village), while simultaneously serving the broader goals of a research protocol. Best of all will be if citizen scientists feel empowered to ask and answer their own research questions, an endeavour we hope our method, and the online tool in particular, will encourage and facilitate.
To find out more about estimating species richness, read our Methods in Ecology and Evolution article ‘Seen once or more than once: applying Good–Turing theory to estimate species richness using only unique observations and a species list’.

Everything is very open with a very clear clarification of the issues.
It was really informative. Your site is useful. Thank you for
sharing!